Strategy chairman Michael Saylor posted “Feeling ₿ullish” on X at 13:08 UTC on Thursday, November 5, with BTC USD at $79,541, and within three hours Bitcoin had fallen to $75,826 as a Wall Street chip-stock crash hit crypto.
Few posts have aged faster.
The picture shows Saylor in a dark suit, standing in front of a giant bull’s shadow. By Friday morning the post had about 410,000 views and 10,000 likes, and Bitcoin was trading near $75,790, down 4.7% from the moment he hit send. Pretty ironic.
Feeling ₿ullish. pic.twitter.com/kN4P1h0QEo
— Michael Saylor (@saylor) November 5, 2026
The drop came from stocks. Wall Street opened at 14:30 UTC, the Philadelphia Semiconductor Index went on to close down 12.2%, and Bitcoin fell from $78,288 to $75,568 in the 15:00 UTC hour alone. It touched $75,208 late on Thursday.
The irony is real, but so is the base rate. Saylor posts something bullish almost every day, so some of those posts will always land right before a drop.
Strategy bought 811 BTC between October 26 and November 1 at an average of $80,846, bringing its holdings to 849,327 BTC at an average cost of $75,451.
At $75,790, Bitcoin is only 0.4% above what Strategy paid on average for every coin it owns.
Is Bitcoin Holding Its 50-Week Average?
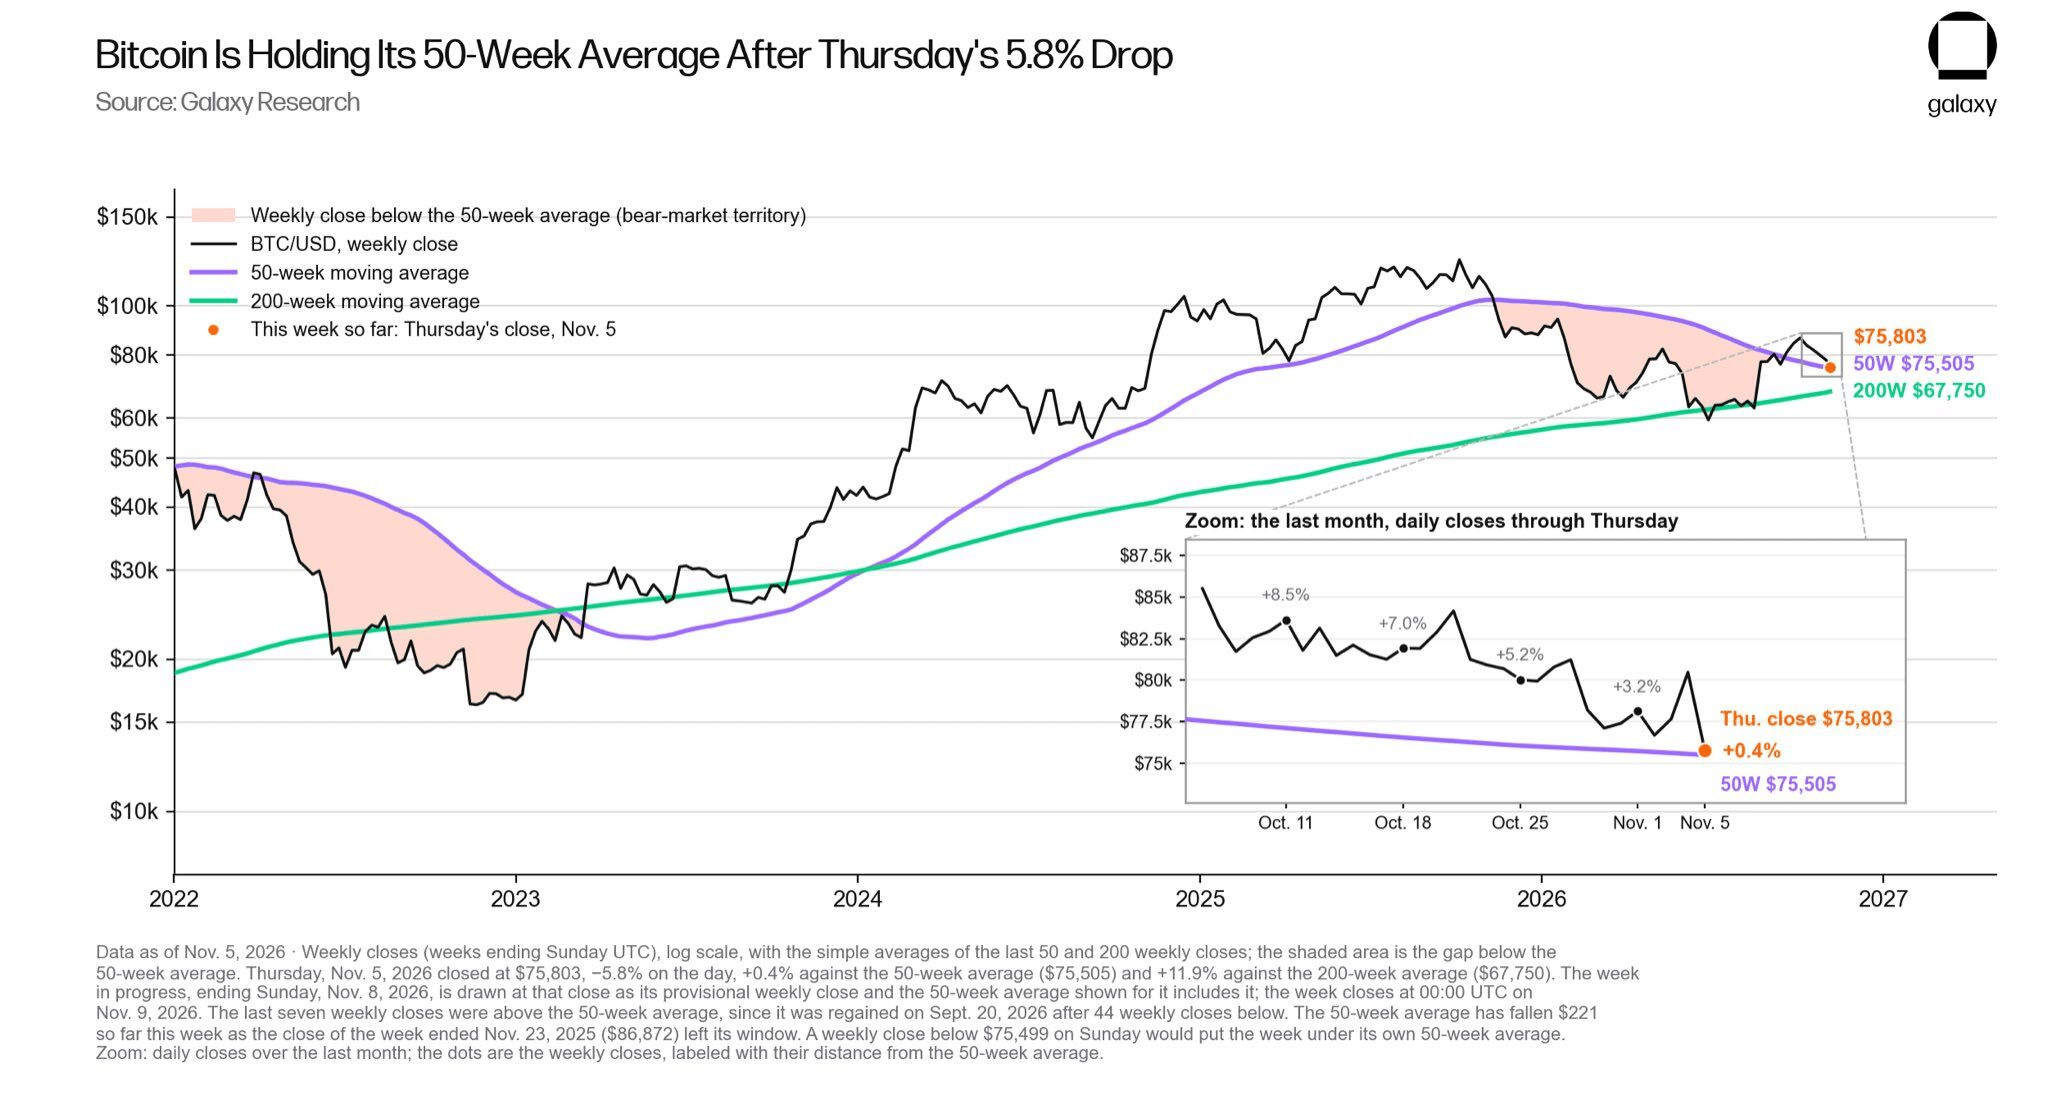
Just about. Galaxy Research puts Bitcoin’s Thursday close at $75,803, 0.4% above its 50-week moving average at $75,505.

Galaxy shades every weekly close under that line as bear-market territory. Bitcoin spent 44 straight weeks below it before reclaiming it on September 20, and it has closed the last seven weeks above.
The 50-week average is also falling, by $221 so far this week. A weekly close below $75,499 on Sunday would put Bitcoin back under it.
One caveat: this week’s candle doesn’t close until 00:00 UTC on Monday, so Thursday’s reading can still change in either direction.
BTC USD Price Analysis: The Weekly Chart
On the weekly chart, Bitcoin sits right on its 50-week simple average near $75,500, which also matches the 50% Fibonacci retracement of the whole 2023-2025 rally.
The 50-week EMA at $78,468 is the first resistance, and the $82,850 swing high is the next. Below the average, the weekly swing low at $74,508 comes first, then the 200-week average at $67,765.

| Path | What has to happen | Next stop |
|---|---|---|
| Push higher | A weekly close above $78,468, the 50-week EMA | $82,850, the weekly swing high |
| Stall | Bitcoin holds between $75,500 and $78,468 | More range trading on the 50-week average |
| Slip | A weekly close below $75,500 | $74,508, then the 200-week average at $67,765 |
Saylor will probably post again before Sunday’s close. Whether the bull shows up on the chart depends on the $75,500 line, not on his feed.
DISCOVER: 15+ Upcoming Coinbase Listings to Watch in 2026
Follow 99Bitcoins on X For the Latest Market Updates, and Subscribe on YouTube For Daily Expert Market Analysis.
The post Michael Saylor Posts “Feeling ₿ullish” 80 Minutes Before BTC USD Drops 5%: Does Strategy’s Chairman Have the Worst Timing on X? appeared first on 99Bitcoins.

