
Ethereum has fallen back toward $2,240 after its recovery toward $2,450 failed, leaving November’s price outlook dependent on whether buyers can defend support while rebuilding momentum.
Summary
- ETH traded near $2,244 on the Nov. 5 daily chart after losing 7.46% during the session.
- Daily Fibonacci support sits near $2,240, while weekly Supertrend support stands around $2,008.
- Analysts identify $2,800 and $3,000 as recovery targets, with important resistance still below both.
- U.S. Ethereum ETFs received $53 million on Nov. 4 after two sessions of withdrawals.
Ethereum price returns to support after another rejection
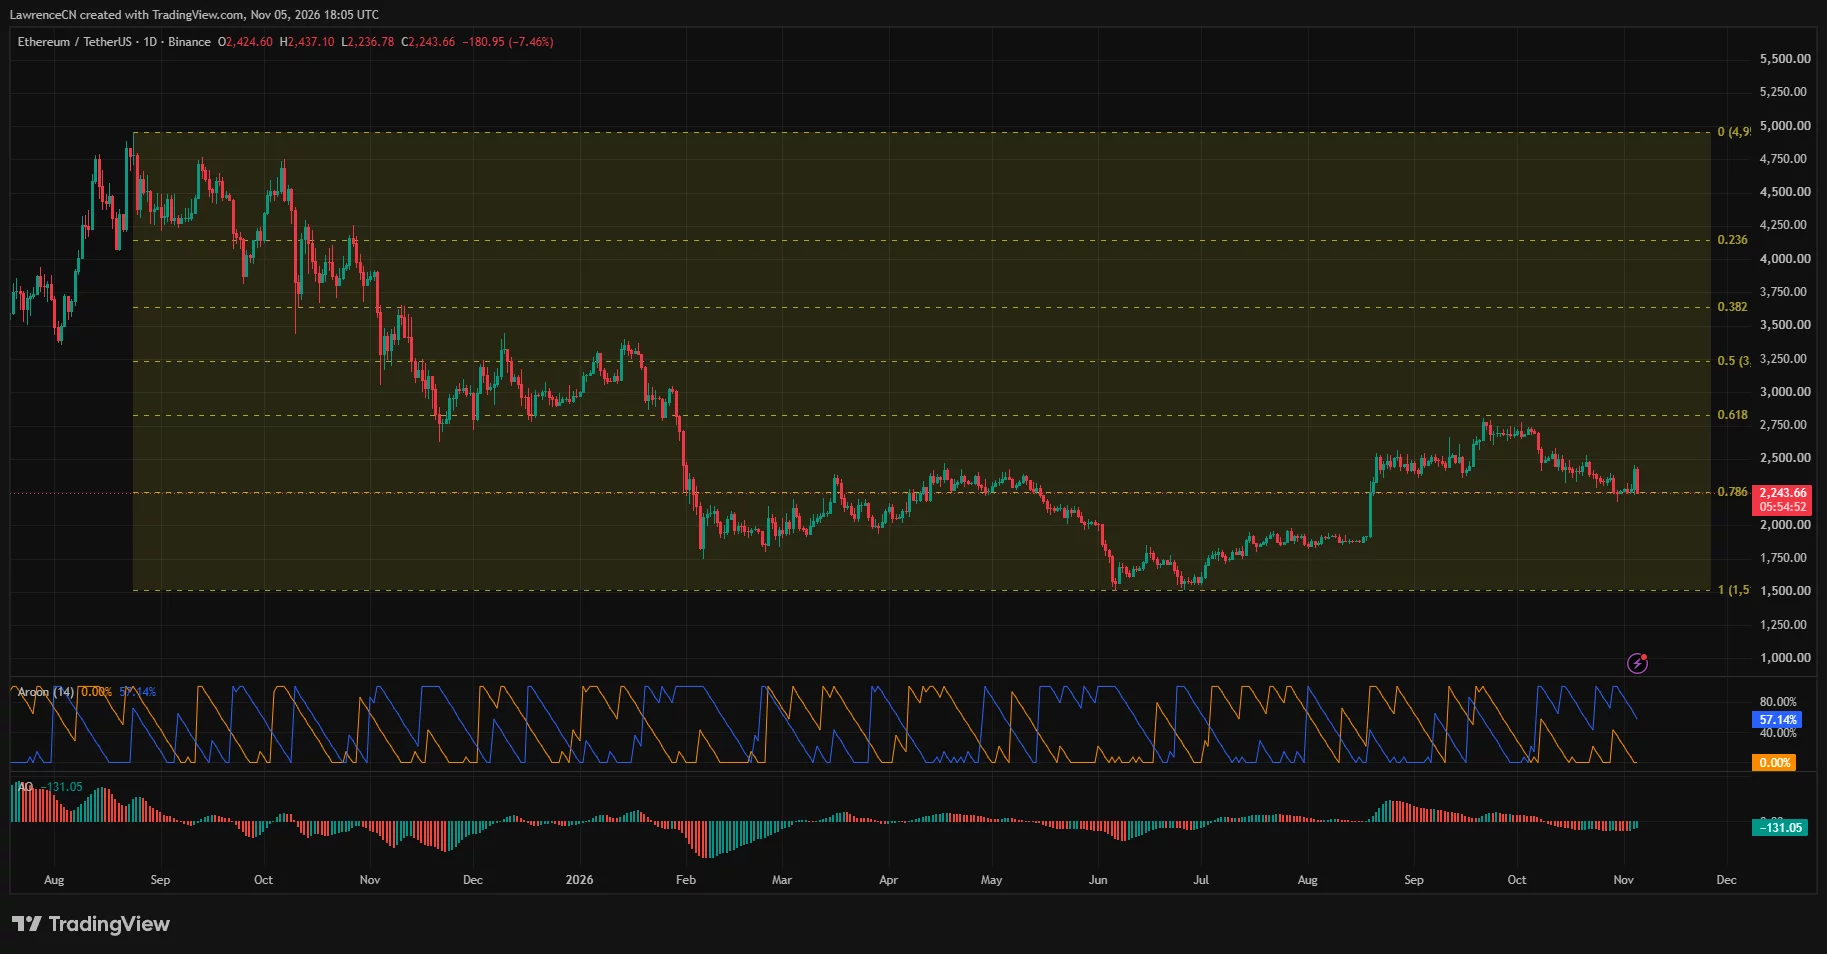
TradingView’s Binance ETH/USDT daily chart placed Ethereum at $2,243.66 at 18:05 UTC on Nov. 5, close to its session low of $2,236.78. The retreat followed an earlier recovery toward the $2,440 area, bringing price back to a zone buyers had defended at the start of November.
On Nov. 1, ETH had recovered above $2,250 and traded near $2,270, as crypto.news previously reported. Returning to that area after briefly reaching higher prices leaves Ethereum with little progress to show from its latest rebound.
The daily Fibonacci retracement, drawn across the approximately $1,500–$4,950 range, places the 0.786 level near $2,240. Price was sitting around that line when the chart was captured, while the same retracement puts the 0.618 level near $2,800.
A sustained move below the current support area would expose the recent lows around $2,170–$2,200. Below them, trader Daan Crypto Trades identifies $2,100 as the more important higher-timeframe level.
“On the high timeframe the levels that matter are $2.1K & $2.8K,” he wrote in a Nov. 5 post following Ethereum’s rejection.
His range leaves room for considerable movement before either boundary gives way. From the daily chart’s $2,244 reference price, reaching $2,800 would require a gain of roughly 25%, while a decline to $2,100 would amount to around 6.4%.
Ethereum’s weekly recovery faces weaker daily momentum
The daily Awesome Oscillator remained below zero at −131.05. Its latest green bars suggest selling momentum has eased, although the negative reading leaves the daily recovery without a positive momentum signal.
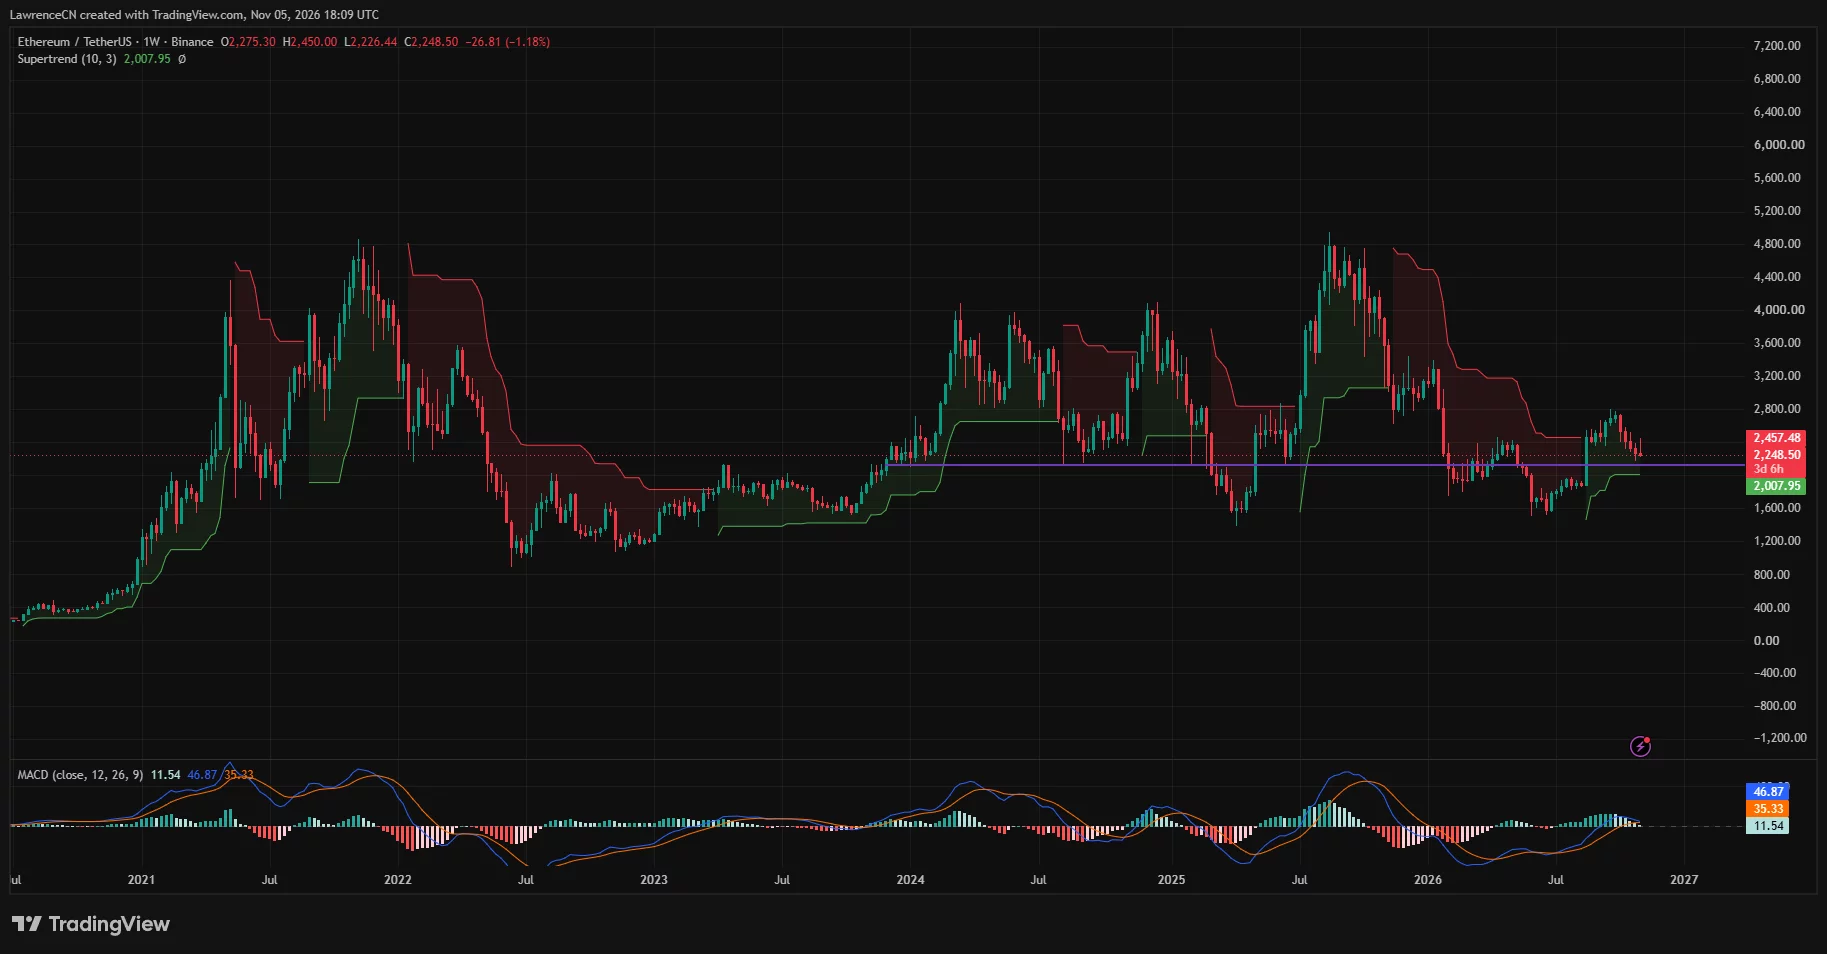
The weekly chart presents a less bearish picture. Ethereum remained above its green Supertrend line near $2,007.95, preserving that indicator’s upward trend signal despite the pullback from the September and October highs.
Weekly MACD stood at 46.87 against a signal line of 35.33, leaving a positive histogram of 11.54. However, the histogram bars had become smaller, suggesting the earlier recovery was losing strength as price moved lower.
Against that mixed backdrop, analyst Michaël van de Poppe said in his Nov. 5 post that Ethereum could break toward $3,000. His setup relied on support around $2,300 and anticipated a shallow pullback toward $2,370 before renewed buying.
By the later chart snapshot, ETH had fallen below both levels. A recovery above $2,300 would therefore be an initial repair of that setup, with the recent $2,440–$2,450 rejection area still overhead.
Reaching $3,000 from $2,244 would require a gain of nearly 34%. His forecast sits above Daan’s $2,800 range ceiling, so reclaiming the range high would be an intermediate hurdle before the higher target comes into view.
The one-month CoinGlass liquidation heatmap shows a prominent concentration around $2,430–$2,460 and a stronger band near $2,635. Those zones identify potential liquidation exposure above price; they remain conditional destinations if Ethereum recovers.
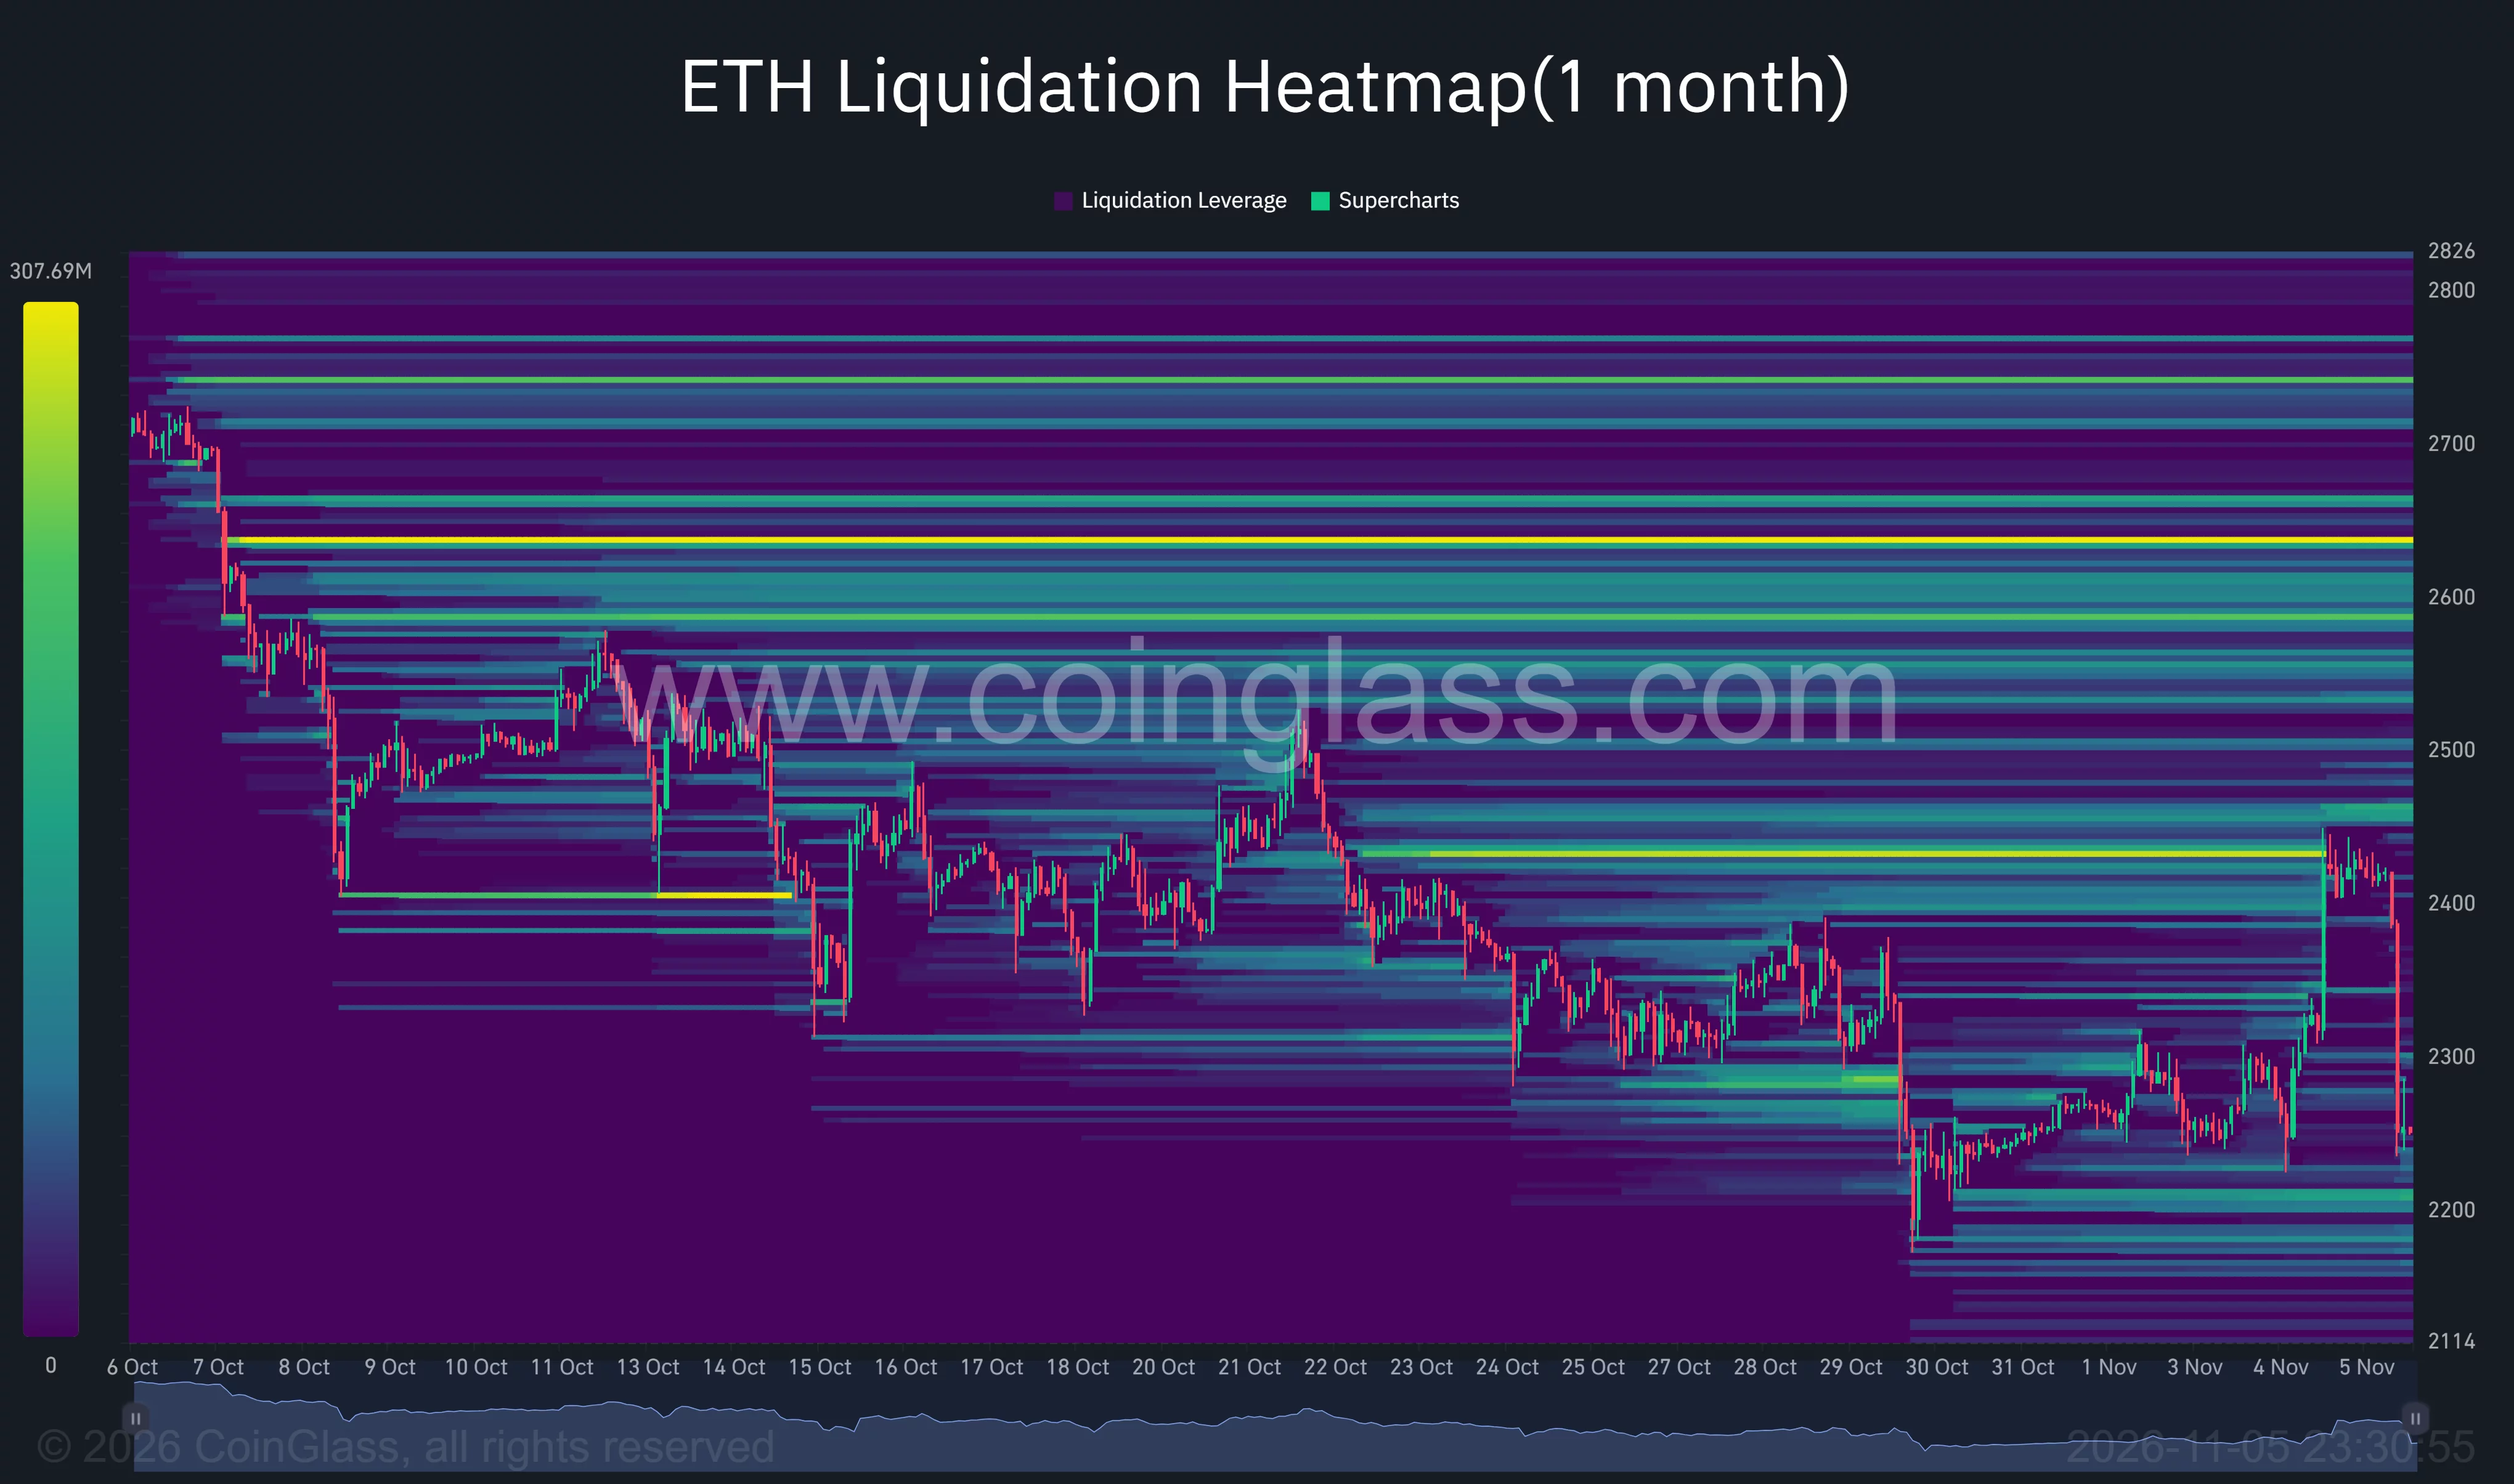
Below the latest price, visible clusters sit around $2,200 and $2,170–$2,180, close to the recent lows.
ETF inflows return, but November’s balance remains negative
Improving fund demand offers some support for the bullish forecasts. Farside Investors’ flow table shows U.S. Ethereum ETFs received $53 million on Nov. 4, including $32.8 million for BlackRock’s ETHA and $19.2 million for Fidelity’s FETH.
The positive session followed withdrawals of $139.7 million on Nov. 2 and $85.3 million on Nov. 3. Across the three sessions, funds still lost $172 million net, with Nov. 4 recovering less than one-quarter of the preceding two days’ withdrawals.
Earlier pressure was concentrated in BlackRock’s Ethereum product. A Nov. 2 update recorded monthly withdrawals of 580,145 ETH, worth $1.32 billion, according to Lookonchain’s tracking.
Bullish relative-strength calls had already emerged before the latest bounce. On Nov. 3, traders highlighted an ETH/BTC trendline breakout, while warning that Ethereum still needed to clear resistance.
In a separate Nov. 5 post, analyst Joep Gerla pointed to a potential bullish weekly structure alongside an altcoin-dominance breakout above a two-year downtrend. His chart depicted successive rounded lows, with the latest formation holding above the midyear trough.
Disclosure: This article does not represent investment advice. The content and materials featured on this page are for educational purposes only.

