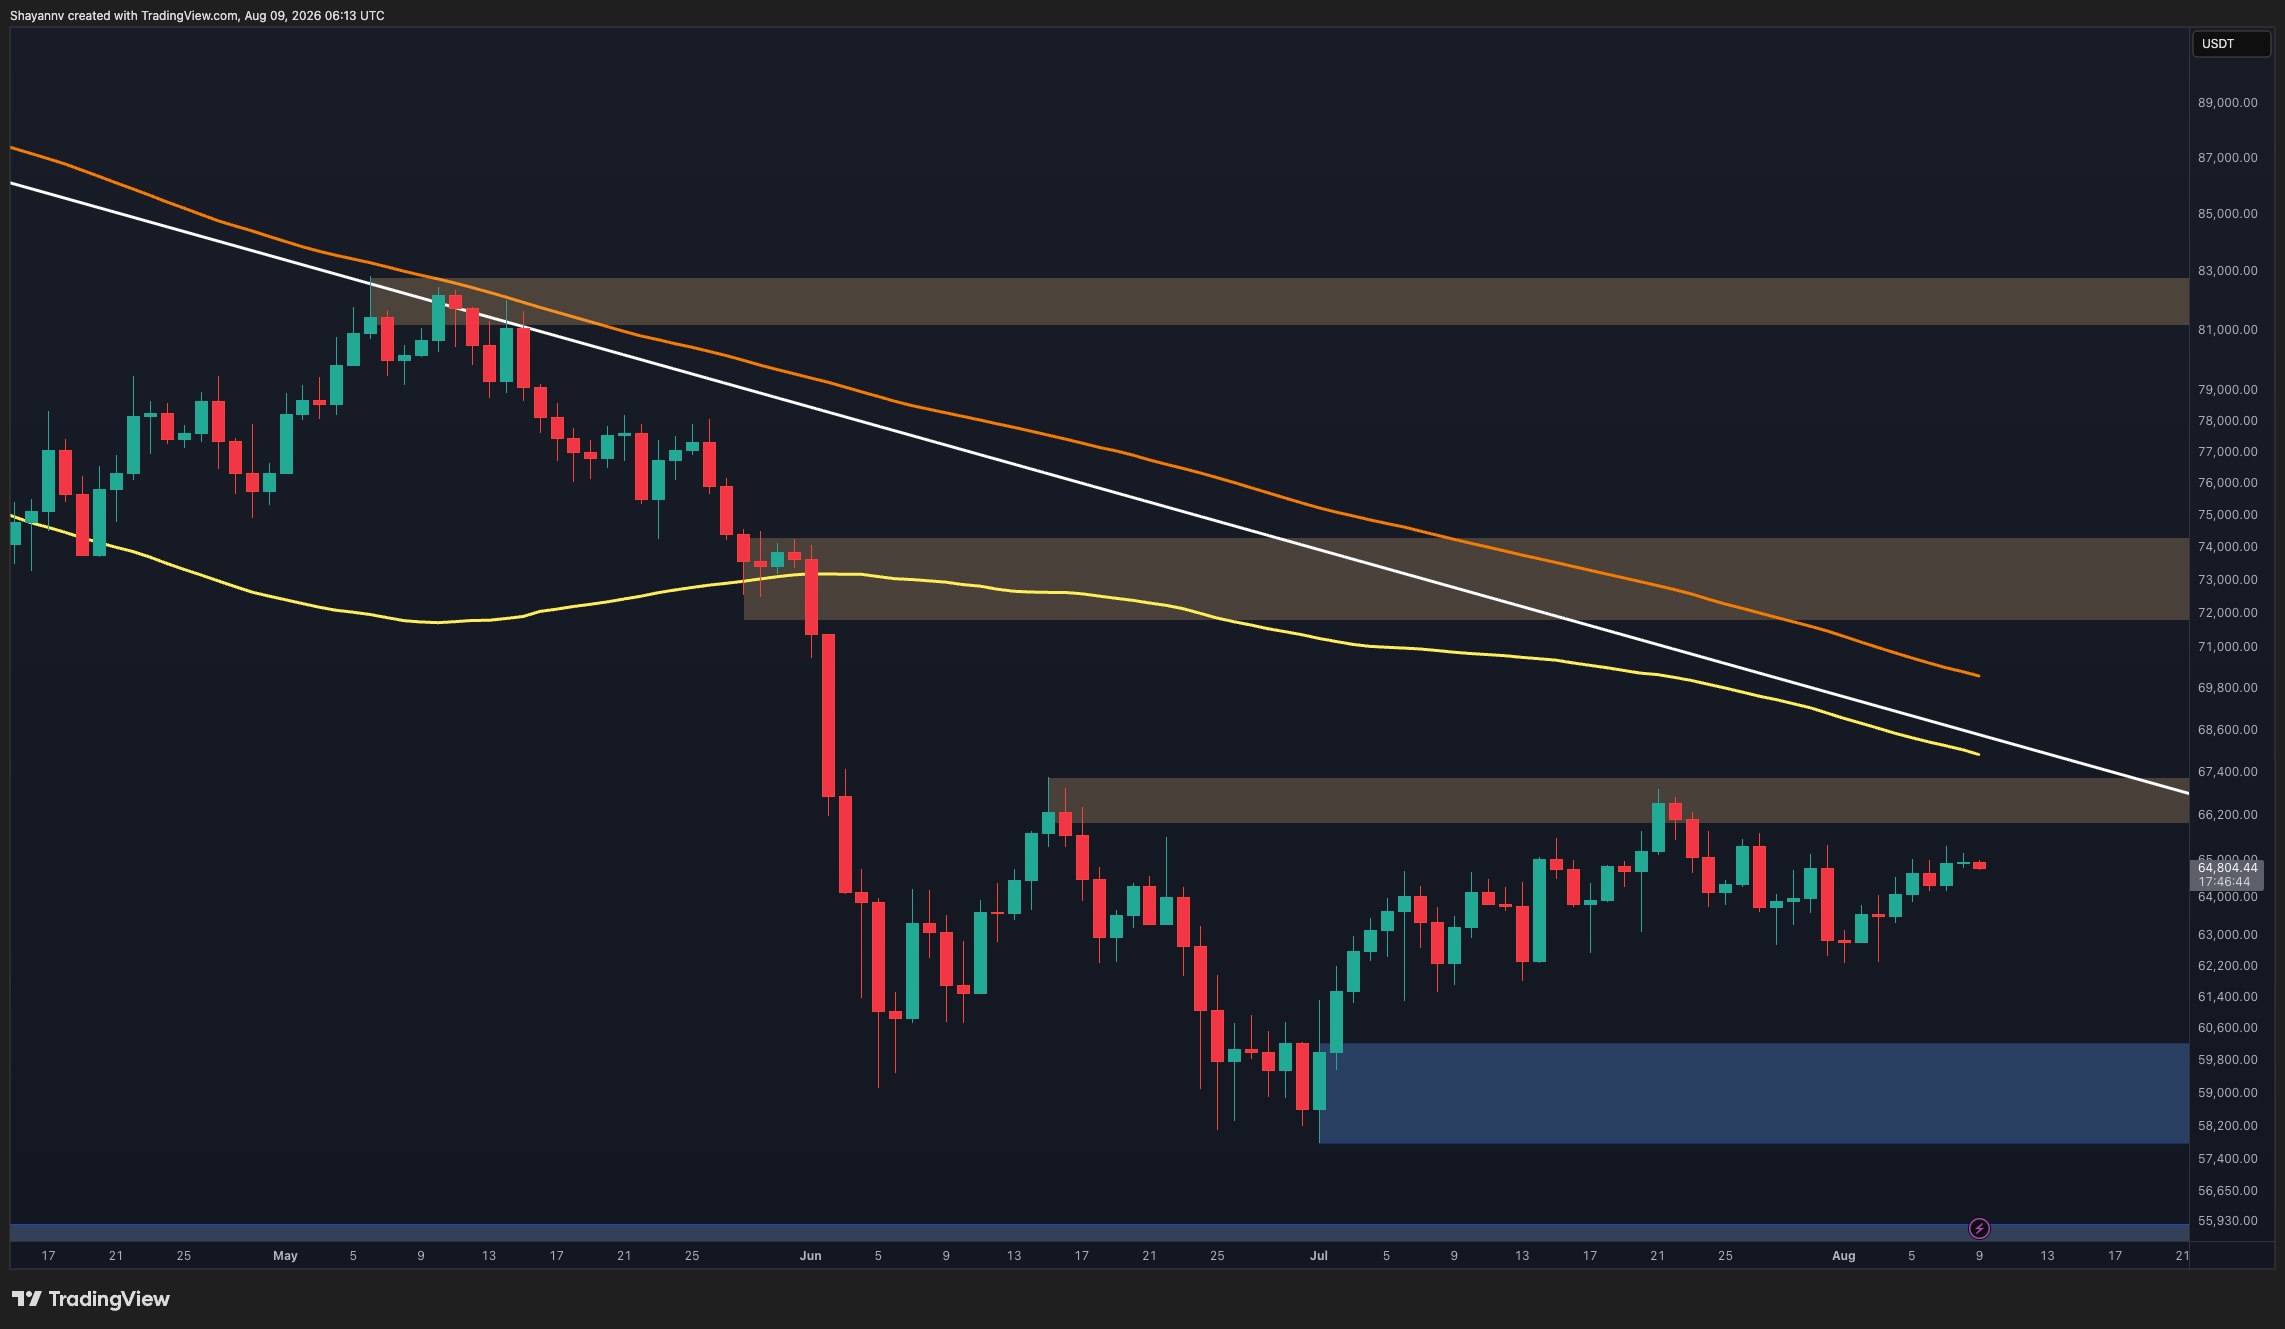
Bitcoin remains trapped in a broader consolidation structure, with the latest recovery failing to generate convincing bullish momentum. The price is again approaching overhead supply, but buyers have yet to produce the type of breakout needed to signal a meaningful structural shift.
Bitcoin Price Analysis: The Daily Chart
On the daily timeframe, BTC is trading around $65K after recovering from the late-June lows. However, the rebound continues to lack strong bullish momentum, with recent candles becoming relatively compressed as the price approaches the $65.8K-$66.8K resistance zone.
This area has already capped previous recovery attempts and is now reinforced by the descending white trendline approaching from above. More importantly, Bitcoin remains well below the declining moving averages, leaving the broader market structure tilted to the bearish side despite the recent stabilization.
Therefore, the current advance still appears more like consolidation beneath resistance than the beginning of a confirmed bullish reversal. A decisive daily breakout above the $65.8K-$66.8K zone and the descending trendline would improve the outlook, while another rejection could shift attention back toward the major $57.8K-$60K demand region.
The hesitant price action also appears consistent with a market awaiting greater macro and geopolitical clarity. Developments surrounding US-Iran tensions and the Strait of Hormuz, along with upcoming US inflation data this month, could provide catalysts for volatility. Until a decisive move occurs, Bitcoin may remain vulnerable to sharp liquidity-driven fluctuations within its broader range.
BTC/USDT 4-Hour Chart
The 4-hour chart makes the immediate challenge for buyers even clearer. BTC has recovered significantly from the $61.8K-$62.3K support zone, but the rally has repeatedly struggled to reclaim the orange resistance box around $64.8K-$65.4K.
Recent candles are consolidating around the lower boundary of this supply zone rather than breaking decisively through it. This inability to reclaim resistance despite the recovery from $62K suggests that bullish momentum is fading near a critical threshold.
As long as BTC remains below the $64.8K-$65.4K region, another rejection remains a significant possibility. Such a move could initially unwind the latest recovery and eventually expose the $61.8K-$62.3K support box once again.
Conversely, a clean breakout and sustained acceptance above $65.4K would weaken this bearish scenario and could allow buyers to challenge the larger $65.8K-$66.8K resistance area.

Onchain Analysis
The Realized Price UTXO Age Bands provide additional context for Bitcoin’s current market structure. The chart shows the realized prices of the 1-3 month and 3-6 month holder cohorts, which currently sit above spot price at approximately $67K and $72K, respectively.
With BTC trading near $65K, both groups are therefore holding coins at an aggregate unrealized loss. This creates an important overhead cost-basis structure. In particular, the 1-3 month cohort’s realized price around $67K is relatively close to the market and could act as resistance if BTC continues recovering, as recently underwater holders may use a return toward their cost basis to reduce exposure.
The 3-6 month cohort’s realized price around $72K represents another higher threshold. Reclaiming these realized-price bands would indicate that the market is absorbing potential supply from recent buyers and would strengthen the recovery narrative. Until then, their position above spot price complements the technical picture, where Bitcoin continues to face substantial resistance overhead.

Disclaimer: Information found on CryptoPotato is those of writers quoted. It does not represent the opinions of CryptoPotato on whether to buy, sell, or hold any investments. You are advised to conduct your own research before making any investment decisions. Use provided information at your own risk. See Disclaimer for more information.

