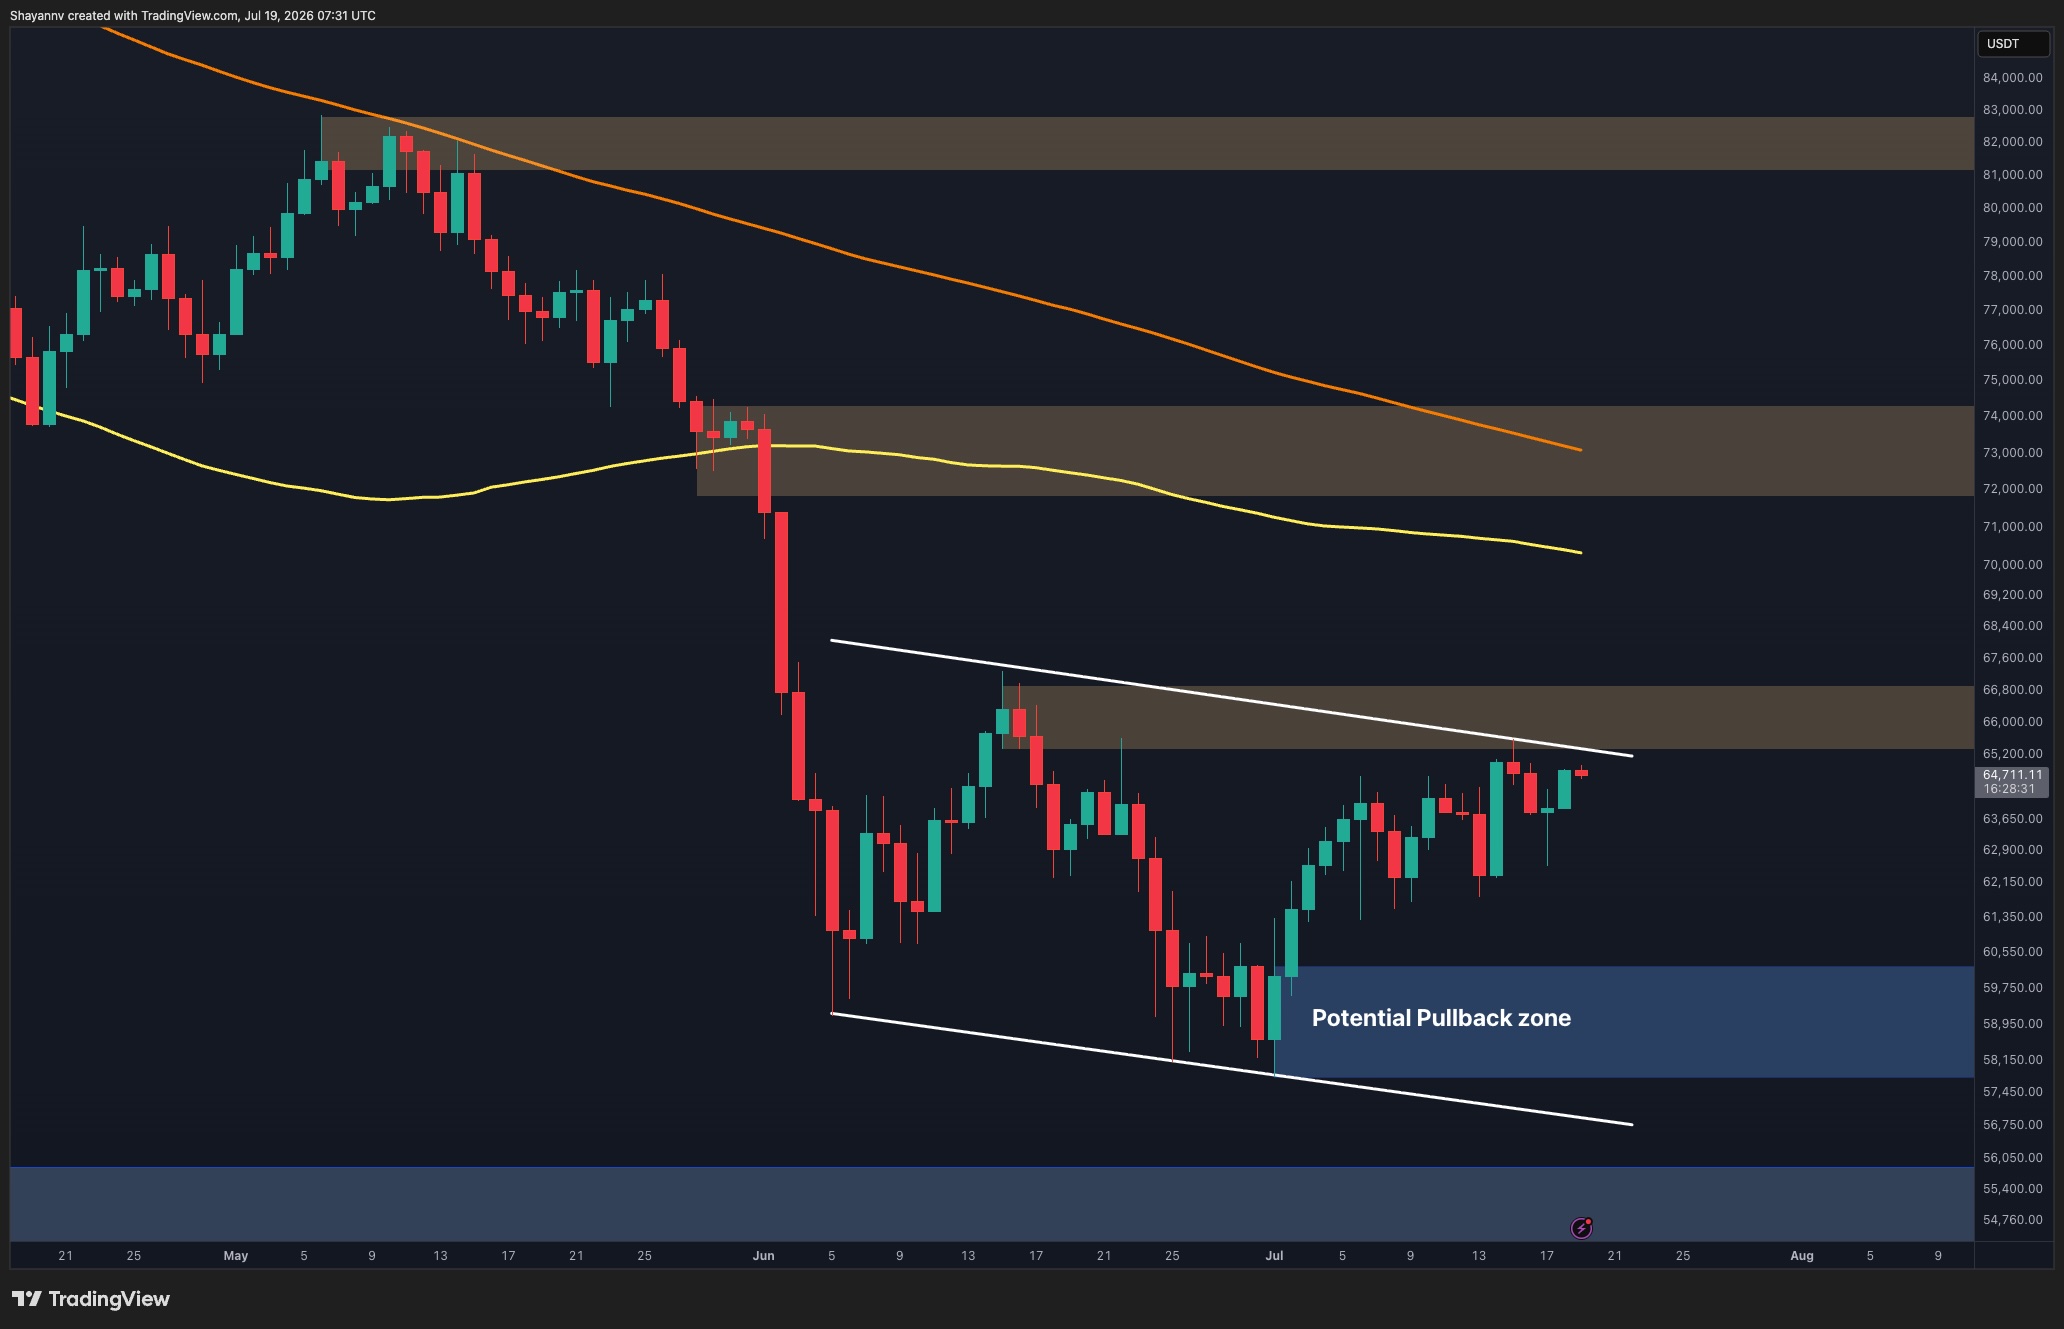
Bitcoin continues to recover from its June capitulation but remains trapped beneath a major resistance cluster. Although buyers have managed to defend higher lows on the lower timeframe, the market is still approaching a critical confluence that could determine whether the recovery extends or transitions into another rejection.
BTC Price Analysis: The Daily Chart
On the daily timeframe, BTC continues to trade below the 100-day and 200-day moving averages, keeping the broader trend tilted to the downside.
The asset is now approaching the $65K-$66.5K supply zone, which also coincides with the descending long-term trendline. This confluence has capped every recovery attempt since the sharp breakdown in early June, making it the key barrier that bulls must reclaim to shift the higher-timeframe structure.
A successful breakout above this region would expose the next resistance between $72K and $74K. However, another rejection from the current supply zone would likely trigger a corrective move toward the $58K-$60K support area, which now represents the most important demand zone on the daily chart.
BTC/USDT 4-Hour Chart
The 4-hour chart shows Bitcoin consolidating within a rising channel after establishing a series of higher lows throughout July.
BTC is once again testing the upper boundary of the channel while simultaneously approaching the higher-timeframe supply zone around $65K-$66.5K. This creates a significant confluence of resistance, suggesting that bullish momentum is entering an important decision area.
As long as Bitcoin remains above the $61K-$62K support zone, buyers maintain a short-term advantage and another attempt to break the overhead resistance remains likely.
However, failure to overcome the confluence of the channel resistance, descending trendline, and supply zone could result in another pullback toward the $58K-$60K demand region. Since this price action pattern typically hints at a potential decline, Bitcoin is poised for another bearish leg, testing the lower demand zones.

Sentiment Analysis
The Realized Price UTXO Age Bands indicate that the realized prices of the 1-3 month and 3-6 month holder cohorts have converged near the current market structure, both sitting around the low $70K area.
Historically, the convergence of these younger holder cost bases often reflects a period of market transition, as recently accumulated coins begin to change hands at similar prices. At present, both realized price levels remain well above Bitcoin’s spot price, implying that these cohorts are still holding unrealized losses.
This reinforces the technical picture. While Bitcoin has recovered from its June lows, it remains below the realized cost basis of recent investors, suggesting that sentiment has not fully shifted back in favor of sustained accumulation.
A recovery above these realized price levels would strengthen the case for a broader trend reversal, whereas continued rejection below them would support the view that the current advance is still a relief rally within the broader bearish structure.

LIMITED OFFER for CryptoPotato readers at Bybit: Use this link to register and open a $500 FREE position on any coin!
Disclaimer: Information found on CryptoPotato is those of writers quoted. It does not represent the opinions of CryptoPotato on whether to buy, sell, or hold any investments. You are advised to conduct your own research before making any investment decisions. Use provided information at your own risk. See Disclaimer for more information.

