
Bitcoin has fallen back toward the $77,000 region after losing a key ascending trendline support that had guided its recovery from April lows.
Summary
- Bitcoin fell back toward $77,000 after breaking below a key ascending trendline support and failing to reclaim the 200-day moving average near $80,800.
- U.S. spot Bitcoin ETFs recorded roughly $1.4 billion in weekly outflows, while over $744 million worth of BTC moved to exchanges over the past five days.
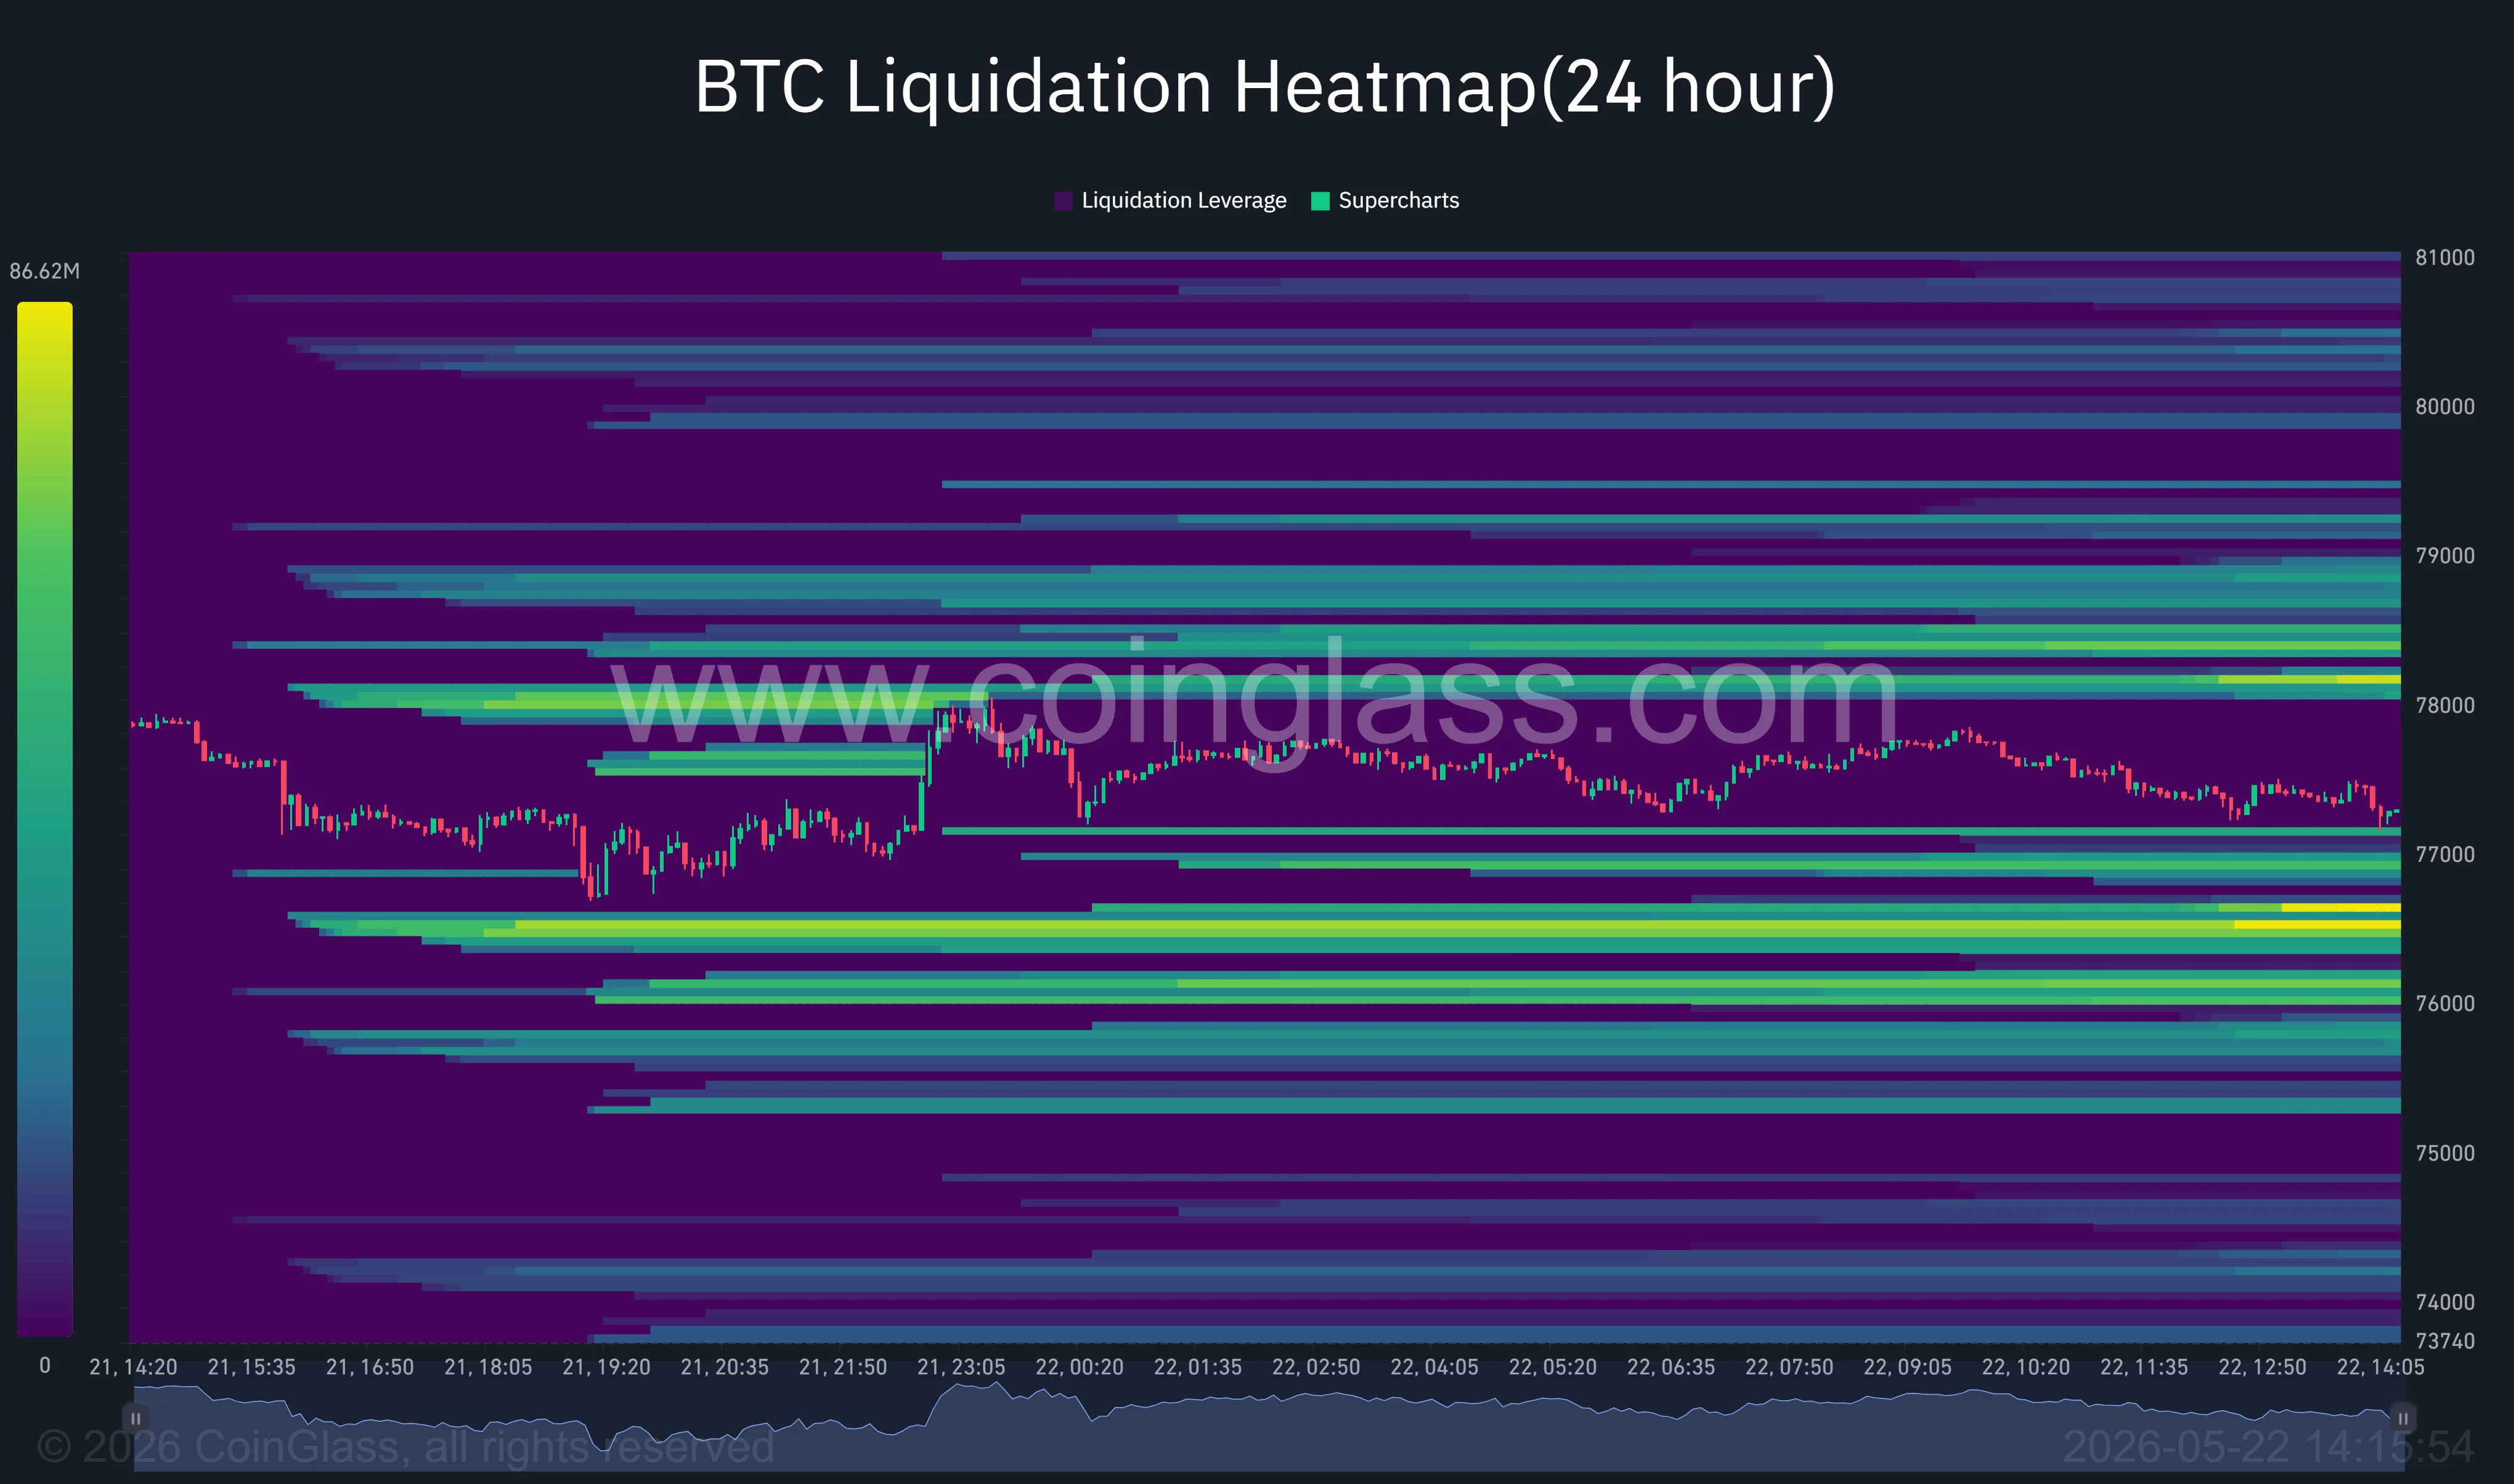
- CoinGlass liquidation data showed dense long liquidation clusters near $76,000 as traders monitored rising oil prices, Fed uncertainty, and U.S.–Iran tensions.
According to data from crypto.news, Bitcoin (BTC) price traded near $77,200 during Friday’s session after briefly losing the rising support structure that had guided its recovery from April lows. Selling pressure accelerated after Bitcoin once again failed to reclaim the $82,000 resistance area, a level that coincides with a descending local trendline and the 200-day moving average near $80,825 on the daily chart.
Over the past week, leveraged bullish positions have absorbed the bulk of the damage. According to derivatives data, nearly $661 million to $850 million in long liquidations were wiped out across exchanges as Bitcoin reversed lower from its May highs. The liquidation cascade amplified downside momentum as forced selling pushed spot prices into lower liquidity zones.
At the same time, U.S. spot Bitcoin ETFs recorded roughly $1.4 billion in cumulative net outflows over the past week. It signals a sharp slowdown in institutional demand following months of post-halving accumulation. BlackRock’s IBIT reportedly registered one of its largest daily outflow sessions during the move, while other major issuers also posted consistent redemptions as traders reduced risk exposure.
On-chain flows added another bearish signal. Analysts noted that 9,664 BTC worth more than $744 million had been transferred to exchanges over the last five days, often interpreted as a sign of rising sell-side intent. Separately, on-chain tracker Lookonchain reported that Trump Media & Technology Group moved another 2,650 BTC valued at roughly $205 million to Crypto.com, further increasing market focus on potential large-holder distribution.
Adding to market sensitivity, Friday’s decline unfolded during Bitcoin Pizza Day week, a period that historically draws elevated trading activity and renewed attention to Bitcoin’s long-term gains. Instead of celebratory momentum, traders encountered rising volatility and deteriorating macro conditions.
Outside crypto markets, oil prices reintroduced another layer of pressure. WTI crude futures climbed back above $98 per barrel after reports suggested Iran’s Supreme Leader ordered enriched uranium reserves to remain inside the country, complicating ongoing negotiations with Washington.
The geopolitical dispute intensified after reports emerged that Iran and Oman were working on a framework for permanent toll systems through the Strait of Hormuz, though President Donald Trump reportedly rejected the proposal and insisted the shipping route remain unrestricted.
Even with crude oil price still down more than 3% for the week, energy traders remained cautious as U.S.–Iran negotiations showed mixed signals.
U.S. Secretary of State Marco Rubio said there were “some encouraging signs” surrounding a possible deal, while Pakistani mediators were expected to travel to Tehran during the latest review phase of Washington’s proposal.
Higher oil prices have compounded inflation concerns that were already building after recent U.S. CPI and PPI readings came in above expectations. Treasury yields climbed toward yearly highs as markets reduced expectations for aggressive Federal Reserve rate cuts. Investors are also preparing for a potential leadership transition from Jerome Powell to Kevin Warsh at the Fed, a scenario many traders associate with a more hawkish policy outlook.
Under those conditions, capital rotation away from speculative assets accelerated across global markets. Bitcoin, which had benefited from strong institutional inflows earlier this quarter, now faces a more difficult liquidity environment as investors prioritize yield-bearing instruments and reduce leveraged exposure.
Can Bitcoin hold the $76K region after losing ascending support?
Technically, Bitcoin’s daily structure has weakened after the price broke below a rising white trendline that had connected higher lows since early April. The breakdown occurred shortly after repeated rejection beneath the descending red resistance trendline near $82,000, reinforcing the formation of a lower high on the daily timeframe.
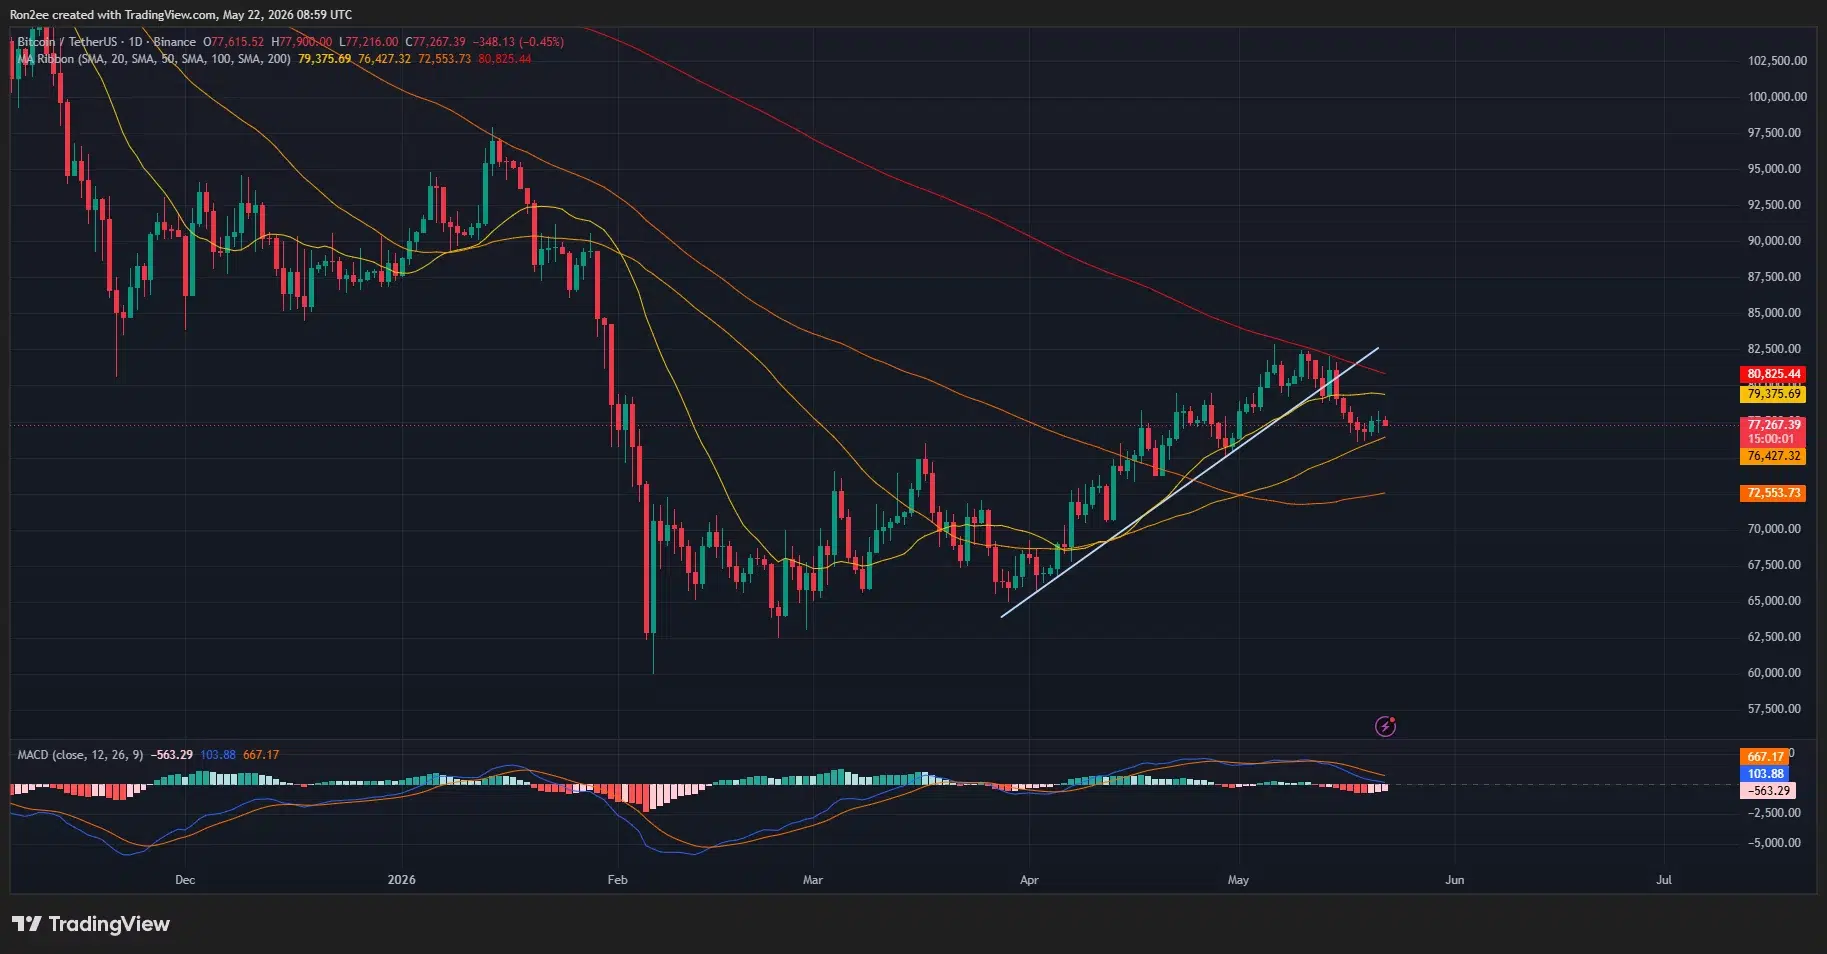
The breakdown also pushed Bitcoin beneath its 20-day moving average around $79,375 while keeping the price trapped below the 200-day moving average near $80,825.
Meanwhile, the 50-day moving average around $76,427 has emerged as the next major technical support. Daily candles are now compressing between declining short-term resistance and the rising 100-day moving average near $72,553.
The MACD histogram on the daily chart has turned negative, while the MACD line itself is beginning to cross lower beneath the signal line. Earlier bullish momentum from April’s recovery phase has faded steadily throughout May as buyers failed to produce a convincing breakout above resistance.
Liquidation data from CoinGlass suggests Bitcoin may still be vulnerable to another sweep lower before stabilization occurs. The 24-hour liquidation heatmap shows dense long liquidation clusters sitting between $76,000 and $76,500, with another concentration near $74,000. Large liquidity pockets above the current price remain concentrated near $78,000 to $79,000, potentially acting as short-term magnets during relief bounces.
Crypto trader Lennaert Snyder said Bitcoin’s daily candle had closed “pretty weak” after failing to reclaim the $78,200 highs. According to Snyder, the market remains trapped in a choppy mid-range structure, with a likely sweep of “sell-side liquidity at the $76.4K range lows” before any meaningful recovery attempt develops.
Meanwhile, Daniel Reis-Faria, CEO of ZeroStack, told crypto.news that Bitcoin’s rejection near its 200-day moving average signaled weak buying pressure.
“Bitcoin turning lower after struggling to move above its 200-day moving average suggests there still may not be enough buying to push prices higher…If buying starts to pick up again, Bitcoin can move higher pretty quickly. But until that happens, Bitcoin is likely to stay under pressure.”
Daniel Reis-Faria, CEO of ZeroStack.
Derivatives positioning also points to lingering caution rather than aggressive dip buying. Funding rates across several perpetual futures platforms have cooled significantly compared to earlier May levels, while open interest has fallen alongside price, signaling ongoing deleveraging instead of fresh speculative participation.
What could invalidate the bearish Bitcoin outlook?
Bitcoin’s recovery back above $79,000 would be the first sign that sellers are losing short-term control. Beyond that, Bitcoin would still need to reclaim the 200-day moving average near $80,800 and invalidate the descending resistance trendline before traders begin discussing a sustainable reversal structure.
Any breakthrough in U.S.–Iran negotiations capable of pulling oil prices lower could ease inflation concerns and reduce pressure on Treasury yields. Softer economic data or renewed expectations for Federal Reserve easing would likely improve sentiment across crypto and equity markets simultaneously.
ETF demand also remains a critical variable. Persistent outflows have weighed heavily on spot liquidity during the latest correction. A reversal back into net positive inflow territory could stabilize price action quickly, especially given how aggressively leverage has already been flushed from the system over the past week.
Failure to hold the $76,000 region, however, could expose Bitcoin to a deeper move toward the $74,000 liquidity zone highlighted on derivatives heatmaps. Below that level, traders may begin targeting the 100-day moving average near $72,500 as the next major structural support during a prolonged risk-off phase.
Disclosure: This article does not represent investment advice. The content and materials featured on this page are for educational purposes only.
