
PENGU price has fallen sharply from its late-July peak, yet analysts suggest the decline could set the stage for a stronger rebound in September.
Summary
- PENGU trades at $0.027, down 35% from July’s local high.
- NFT market slump and ETH pullback drove selling pressure.
- Analysts see September catalysts as setup for a rebound.
The Pudgy Penguins (PENGU) token is trading at $0.027 as of press time, down roughly 35% from its July 28 local high of $0.043. After declining 13% over the past week and 20% over the past 30 days, the token is nearly 60% below its peak of $0.068 set in December 2024.
Despite the price decline, trading activity is still strong. PENGU recorded $214.8 million in spot volume over the past 24 hours, up 15% from the day before. Derivatives data from Coinglass show futures turnover rising 24% to $586 million, while open interest dropped 5.3% to $275 million.
During a pullback, rising volume combined with declining open interest often shows that traders are closing positions rather than building new leverage, indicating cautious sentiment.
PENGU price market drivers and sentiment shift
PENGU’s drop is a reflection of the overall cooling of the NFT market, whose monthly volume dropped from a peak of $8.2 billion on Aug. 14 to $6 billion as of press time. Ethereum’s (ETH) price retreat also weighed on valuations despite positive ecosystem developments.
The transition of PENGU from an NFT-linked token to a utility-driven brand has been taking place. The launch of Pudgy Party, a Web3 mobile game on Aug. 29 that quickly surpassed 50,000 downloads and ranked in the top 10 of the App Store, introduced direct utility for the token through in-game purchases and staking rewards.
Short-term on-chain demand, including activity tied to Pudgy Penguins’ mobile game downloads, has not offset profit-taking and portfolio rebalancing by holders.
Still, analyst Ali Martinez suggested in a Sept. 1 post on X that the correction looks like a healthy pause before the next leg higher, pointing to September as a potential turning point for momentum.
PENGU price technical analysis
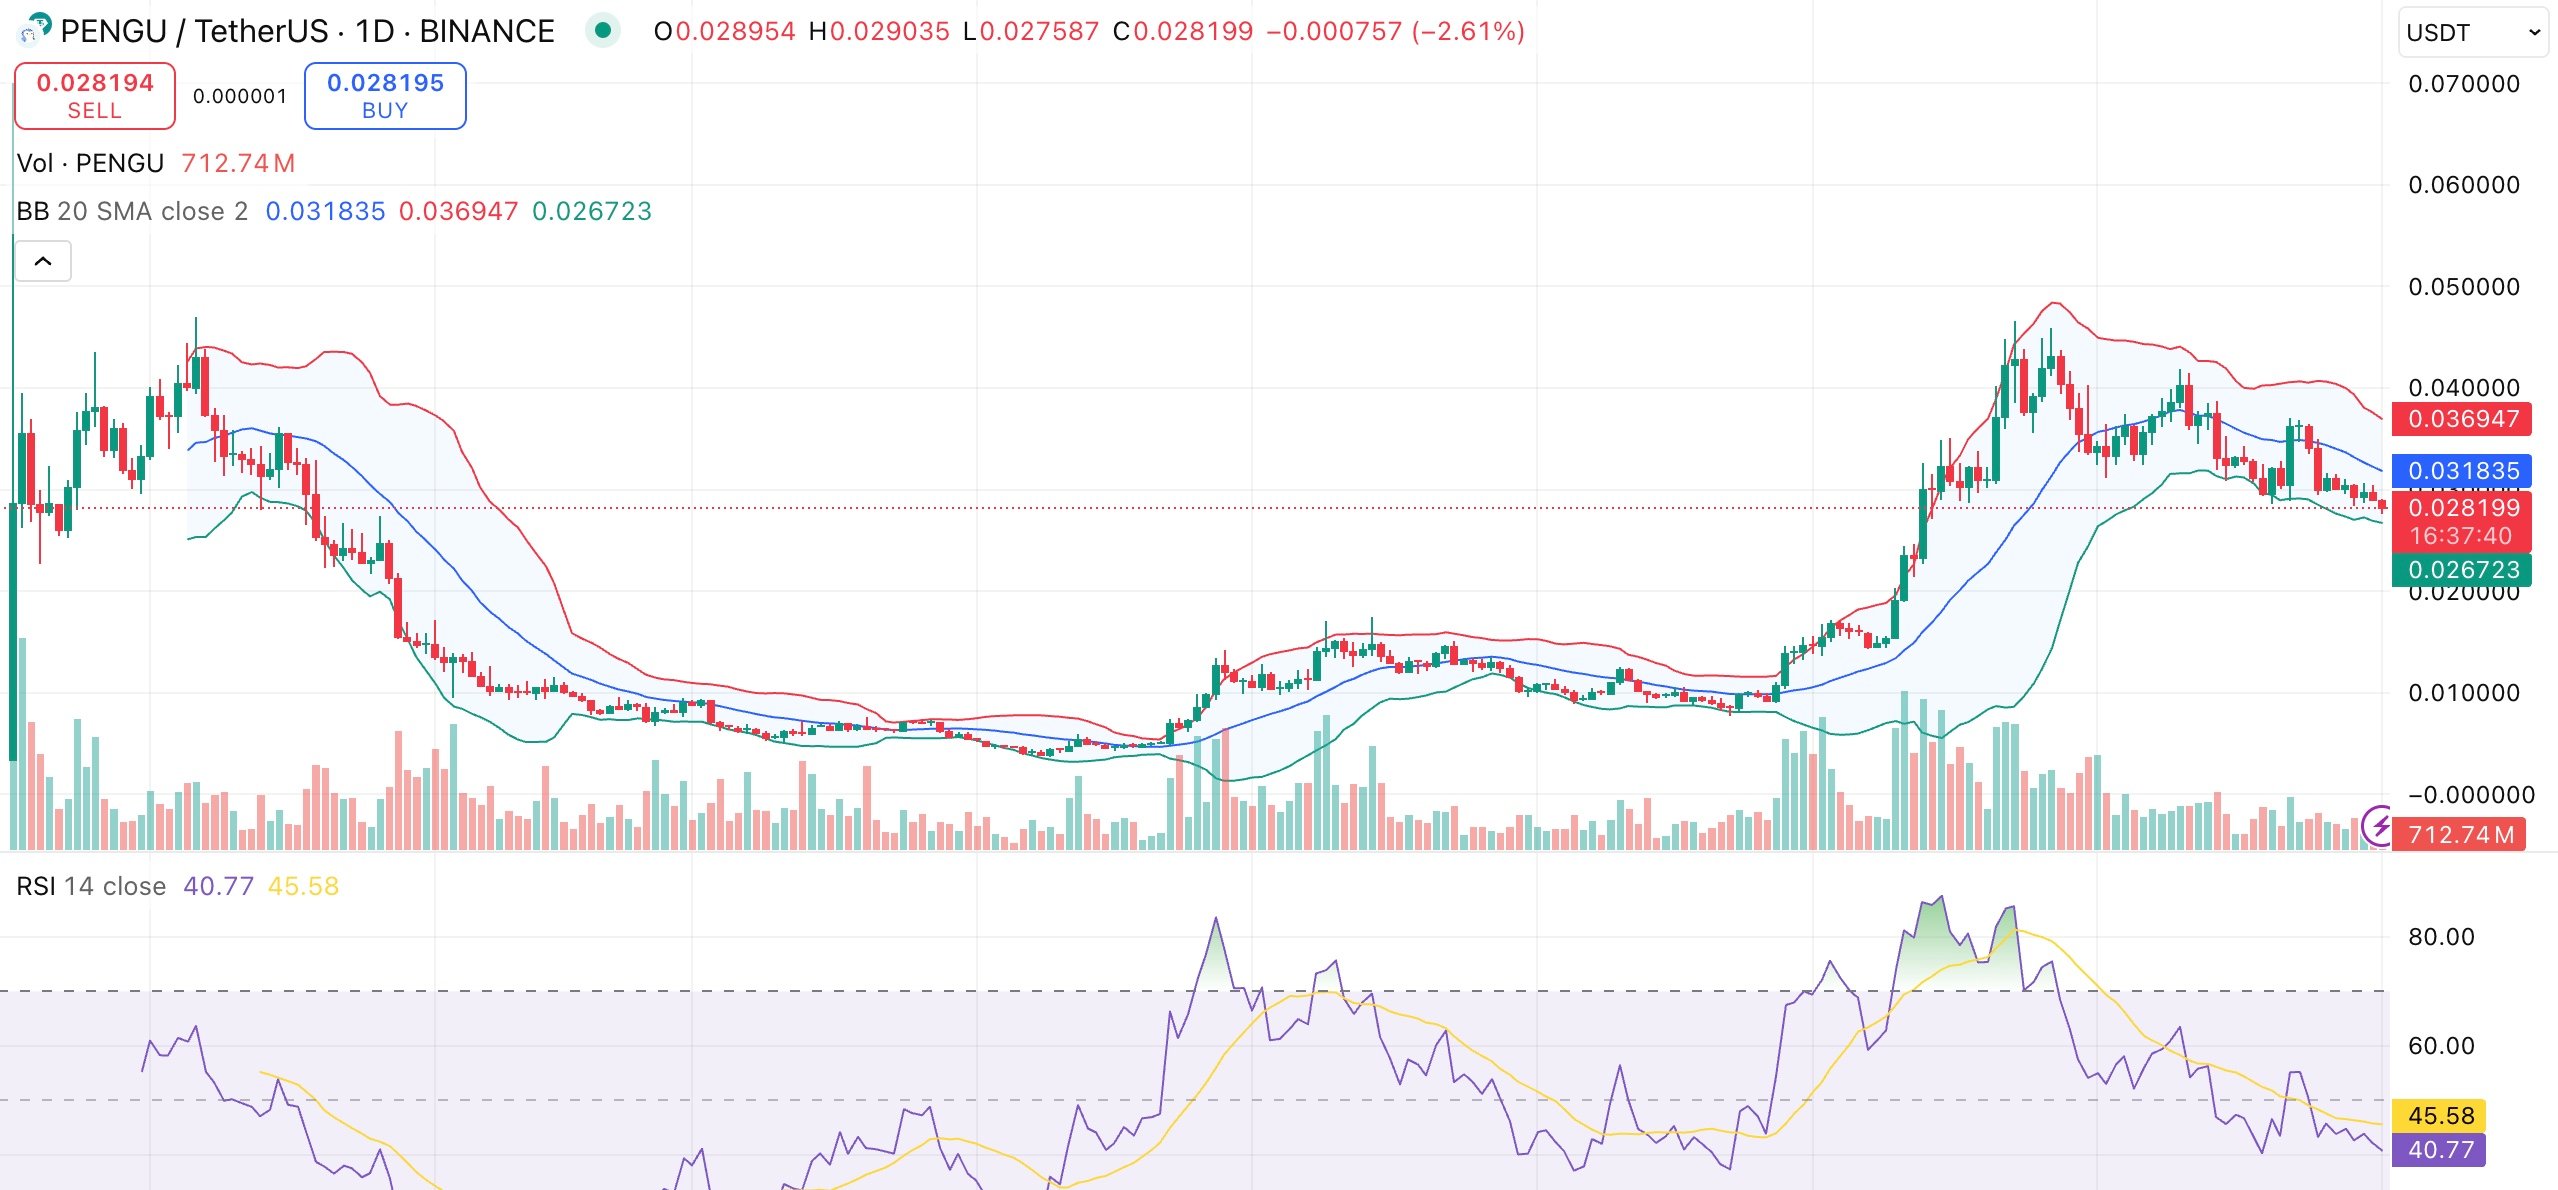
Chart indicators point to consolidation at current levels. The relative strength index, which is presently trading at about 41, a neutral zone just above oversold territory, suggests that there may be room for growth if buyers step in. The Williams %R has already entered deep oversold conditions, historically a reversal zone for PENGU.
Momentum and MACD levels remain negative, and most short- and mid-term moving averages are skewed downward, suggesting short-term bearish pressure. However, the 100-day and 200-day averages continue to be supportive and could sustain the longer-term trend.
If $0.027 continues to be a support base, the next upward target is near $0.032, which is consistent with the 20-day moving average. If current levels are not defended, there may be a retest of the $0.025 region.
Given that Q4 usually signifies periods of peak momentum and September is believed to be a historically active month for cryptocurrency markets, the token’s position around significant support levels may determine its next move.
