
Bitcoin price has recovered toward $80,600 on October 25 after falling below $80,000 during a weekend sell-off that triggered substantial liquidations across cryptocurrency markets.
Summary
- Bitcoin price recovered toward $80,600 on October 25 after briefly falling below $80,000.
- U.S. spot Bitcoin ETFs recorded substantial withdrawals on October 22 and 23.
- CoinGlass data showed $546.88 million in cryptocurrency liquidations during a subsequent 24-hour period.
- CryptoQuant analyst CW8900 reported improving whale holdings despite recent market weakness.
- Bitcoin price faces support around $80,000, while $82,368 and $84,725 remain important resistance levels.
According to crypto.news market data, BTC traded around $80,620, with approximately $20 billion in daily volume. The cryptocurrency briefly reached the $79,200 region before recovering, although buyers have struggled to regain the levels lost during the past several sessions.
Why is Bitcoin price down today?
Selling pressure intensified on October 24 as Bitcoin price slipped below $80,000, triggering forced closures of leveraged trading positions.
CoinGlass data showed approximately $546.88 million in liquidations across cryptocurrency markets over 24 hours, affecting 116,300 traders. The largest reported individual liquidation was an $11.85 million ETH-USDT position on Binance.
Bitcoin price yesterday briefly dropped toward $79,200 before recovering above $80,000. The decline followed several days of weakening demand, with traders facing uncertainty over geopolitical tensions and global financial conditions.
Concerns surrounding the Middle East, elevated oil prices and weakness in technology stocks have weighed on risk appetite. Weekend trading can experience thinner liquidity, making prices more sensitive to large transactions and forced selling.
As crypto.news reported on ETF withdrawals, U.S. spot Bitcoin funds lost approximately $635.5 million on October 22, ending a three-day buying streak that had attracted more than $1 billion.
Bitcoin ETFs record another day of withdrawals
The selling continued into October 23, when U.S. spot Bitcoin ETFs reportedly recorded another $137.9 million in net withdrawals, according to Farside Investors’ records.
Combined, the two sessions produced approximately $773.4 million in net outflows, reducing the impact of the substantial purchases recorded between October 19 and October 21.
Despite the reversal, ETF flows remained positive over the full trading week in available market reports. Reported weekly totals differed, making the exact final balance dependent on the provider and completeness of fund data.
The change in institutional demand followed a period when Bitcoin ETFs attracted $1 billion over three consecutive trading sessions.
Bitcoin’s October performance has remained negative, with the cryptocurrency losing approximately 3.3% month to date. Its trading range has stretched from roughly $79,700 to $86,800, leaving the latest price close to the month’s lower end.
Daily trading volume stood below the reported October average of approximately $28.2 billion, suggesting fewer transactions were taking place during the latest recovery attempt.
Bitcoin whales show signs of renewed accumulation
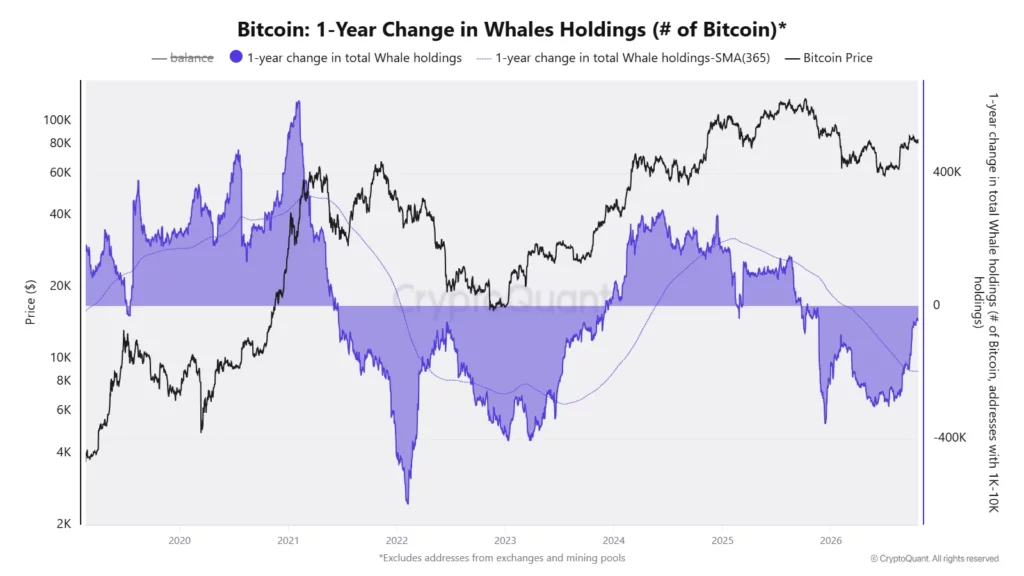
Despite recent selling, CryptoQuant analyst CW8900 reported improving Bitcoin holdings among large investors.
In a CryptoQuant market analysis, the analyst said the one-year change in whale holdings had recovered from approximately -282,000 BTC to -39,000 BTC.
The 243,000 BTC improvement suggests that large holders have reduced their net selling or accumulated additional coins over the measured period. However, the indicator remains negative, meaning the one-year change has not yet turned positive.
Separate reports of 32,380 BTC moving onto exchanges raised concerns about potential selling. Exchange deposits can precede transactions, although transfers into trading platforms do not necessarily establish completed sales.
Crypto analyst Doctor Profit said he continued building long positions around 80,000–81,000 and maintained a target of $94,000.
The analyst described the positions as longer-term holdings and said he would consider further purchases if Bitcoin returned to $80,000.
Bitcoin price prediction: Can BTC defend $80,000?
Bitcoin’s daily chart showed the cryptocurrency trading at $80,626, below its 20-day simple moving average of $82,368.62.
The Bollinger Bands placed the lower boundary near $80,012.66, with the upper boundary at $84,724.59. A sustained recovery above the middle band could improve the short-term outlook, while another breakdown below $80,000 would put $78,000 and potentially $75,000 into focus.
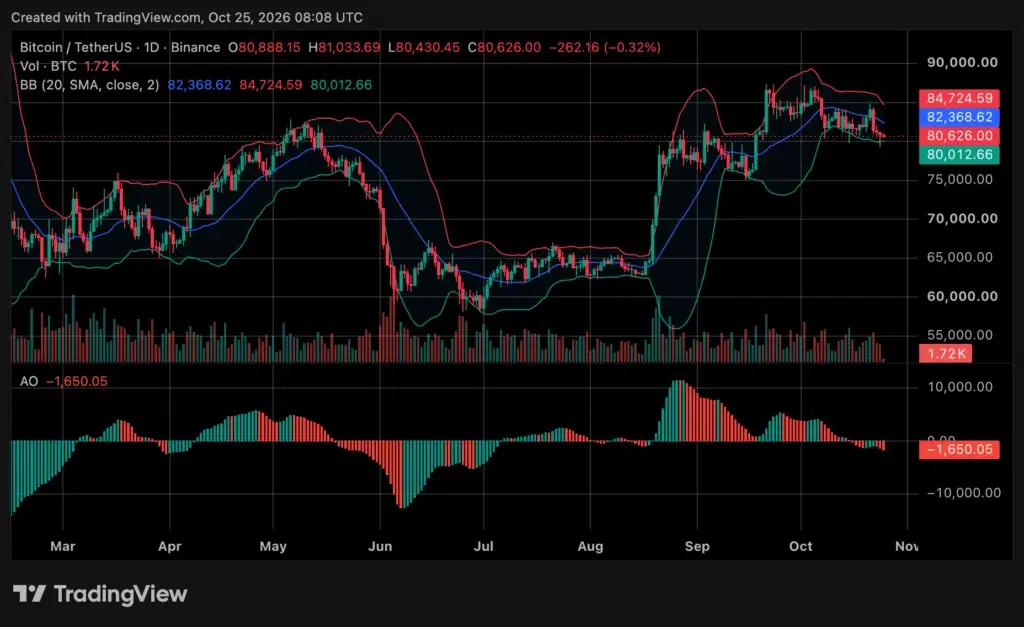
The Awesome Oscillator stood at -1,650.05, with negative histogram readings indicating continued bearish momentum.
Analyst Rekt Capital highlighted Bitcoin’s approaching retest of its 21-week and 50-week exponential moving averages, noting that prices have sometimes moved temporarily below these levels during previous recovery periods.
Separately, Ali Charts compared Bitcoin’s performance around four previous U.S. midterm election cycles, citing declines of 72%, 65%, 52% and 27%.
Those historical comparisons do not establish that another decline will follow the same pattern in 2026.
Disclosure: This article does not represent investment advice. The content and materials featured on this page are for educational purposes only.

