
Zcash price traded near $1,150 on Sep. 8 after a sharp six-day rally carried ZEC from about $814 to a multi-year high of $1,249, with derivatives liquidations and a major technical breakout supporting the move.
Summary
- Zcash price gained more than 53% between its Sep. 3 level and the Sep. 6 peak.
- ZEC remains above the 4-hour Supertrend support at $1,076 despite profit-taking.
- The daily MACD remains bullish, while key moving averages sit far below the current price.
- Liquidation clusters near $1,180 and $1,200 could shape the next short-term move.
Zcash price consolidates after reaching $1,249
According to data from crypto.news, Zcash (ZEC) price was trading at $1,150.62 at the time of the daily chart snapshot, up 0.92% during the session. ZEC opened at $1,140.26 and moved between an intraday low of $1,113.66 and a high of $1,174.03.
The token remains about 8% below the $1,249.28 peak recorded on Sep. 6. However, the pullback has not erased much of the rally that began near $813.95 on Sep. 3. Based on those levels, ZEC gained more than 53% at its peak and was still up about 41% by Sep. 8.
Price action on the 4-hour chart shows ZEC consolidating between approximately $1,110 and $1,170 after the initial correction from the high. Buyers have repeatedly entered near the lower end of that range, although attempts to move beyond $1,170 have faced selling pressure.
The rally followed a derivatives-driven short squeeze that liquidated more than $46 million in bearish positions within 24 hours, according to the supplied market data. Forced position closures added buying pressure as ZEC crossed $1,000 and accelerated toward $1,250.
Daily trading volume also rose above $1.2 billion during the advance, reflecting stronger market participation than Zcash had recorded before the breakout.
ZEC technical indicators remain bullish
The daily chart shows ZEC trading well above all four major moving averages. The 20-day simple moving average stands at $883.74, followed by the 50-day SMA at $650.98 and the 100-day SMA at $560.52.
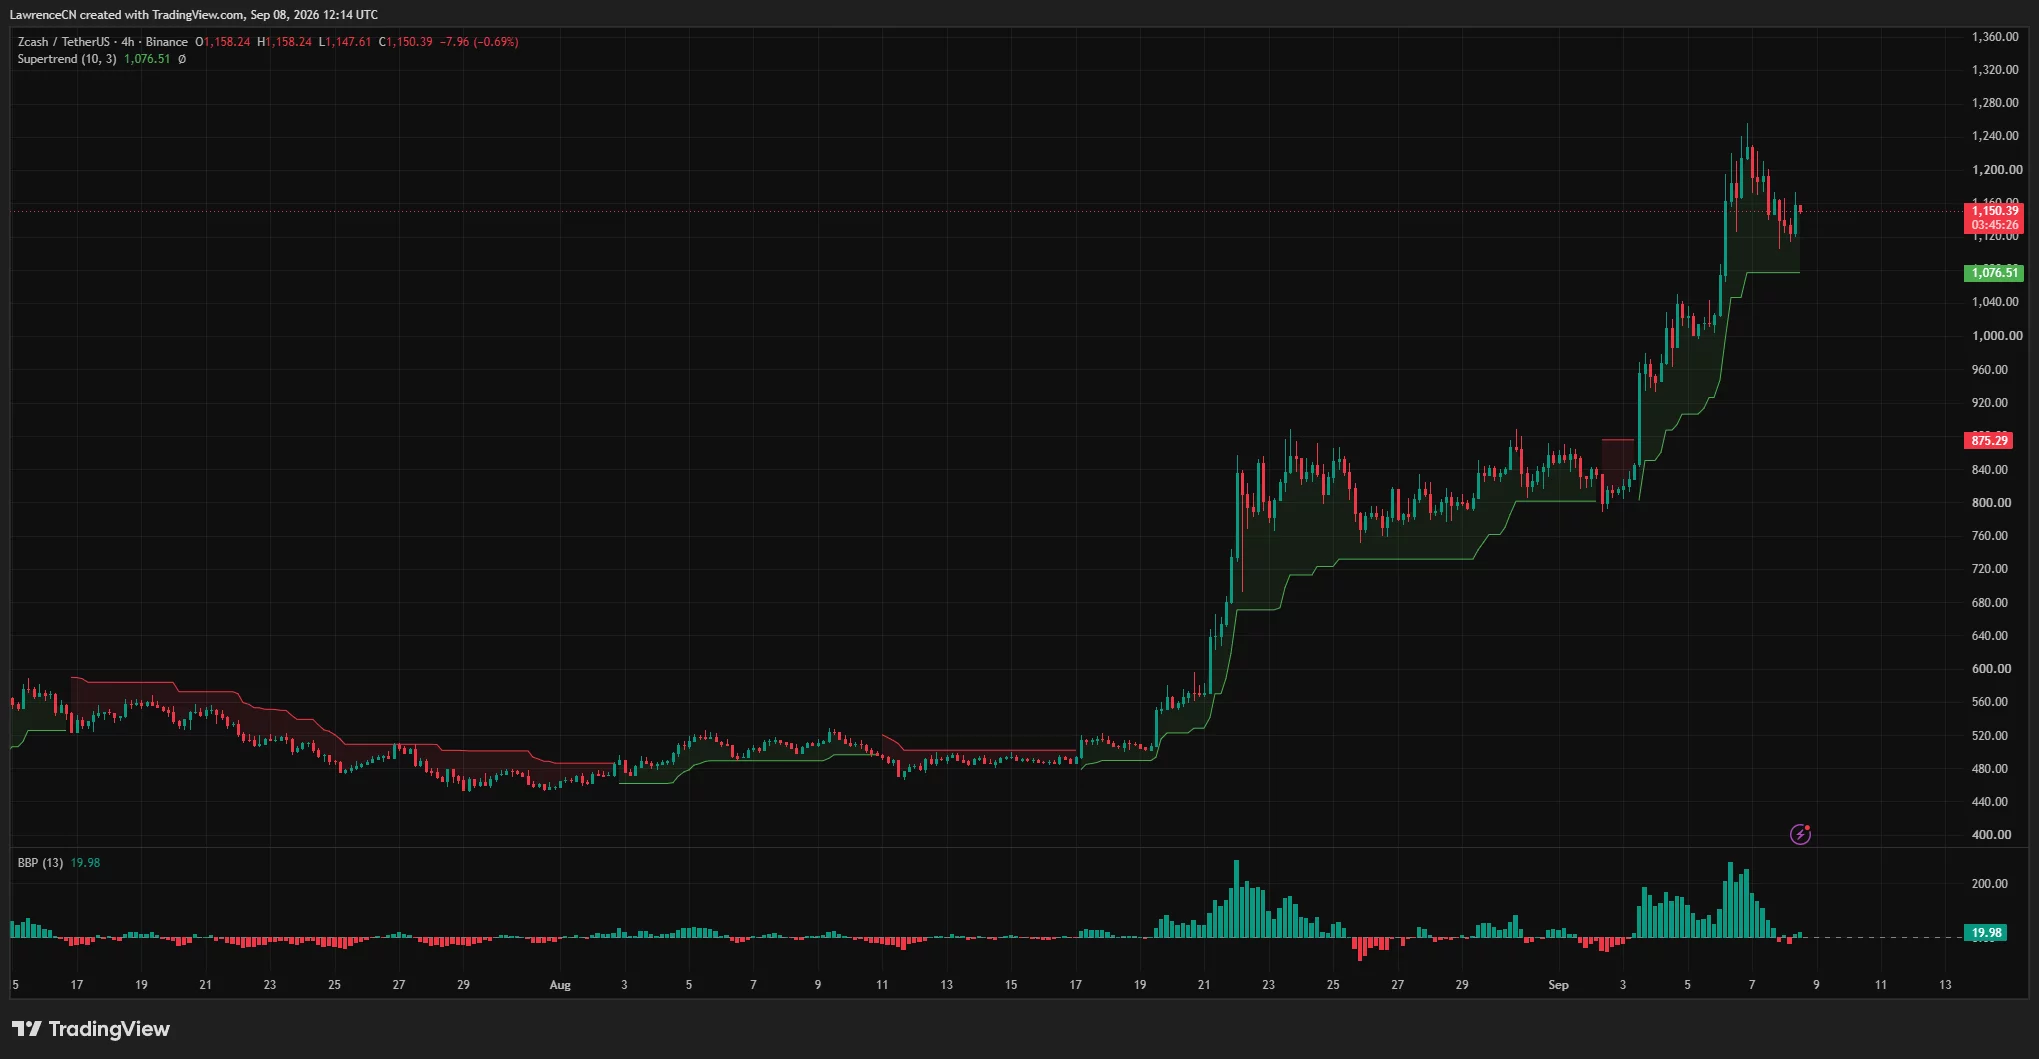
The 200-day SMA is much lower at $458.79. ZEC is therefore trading roughly 151% above its long-term average, confirming the scale of the advance but also showing how far the price has moved from its broader trend line.
Momentum remains positive on the daily Moving Average Convergence Divergence indicator. The MACD line is at 140.71, above the signal line at 112.36, while the histogram remains positive at 28.35.
The positive configuration indicates that buyers still control the broader trend. However, the declining histogram bars following the price peak suggest that bullish momentum is beginning to cool. A continued decline in the histogram would raise the risk of a longer consolidation even if the broader uptrend remains intact.
On the 4-hour chart, the Supertrend indicator provides immediate support at $1,076.51. ZEC has remained above that level throughout the latest pullback, while the Bull Bear Power reading of 19.98 remains positive.
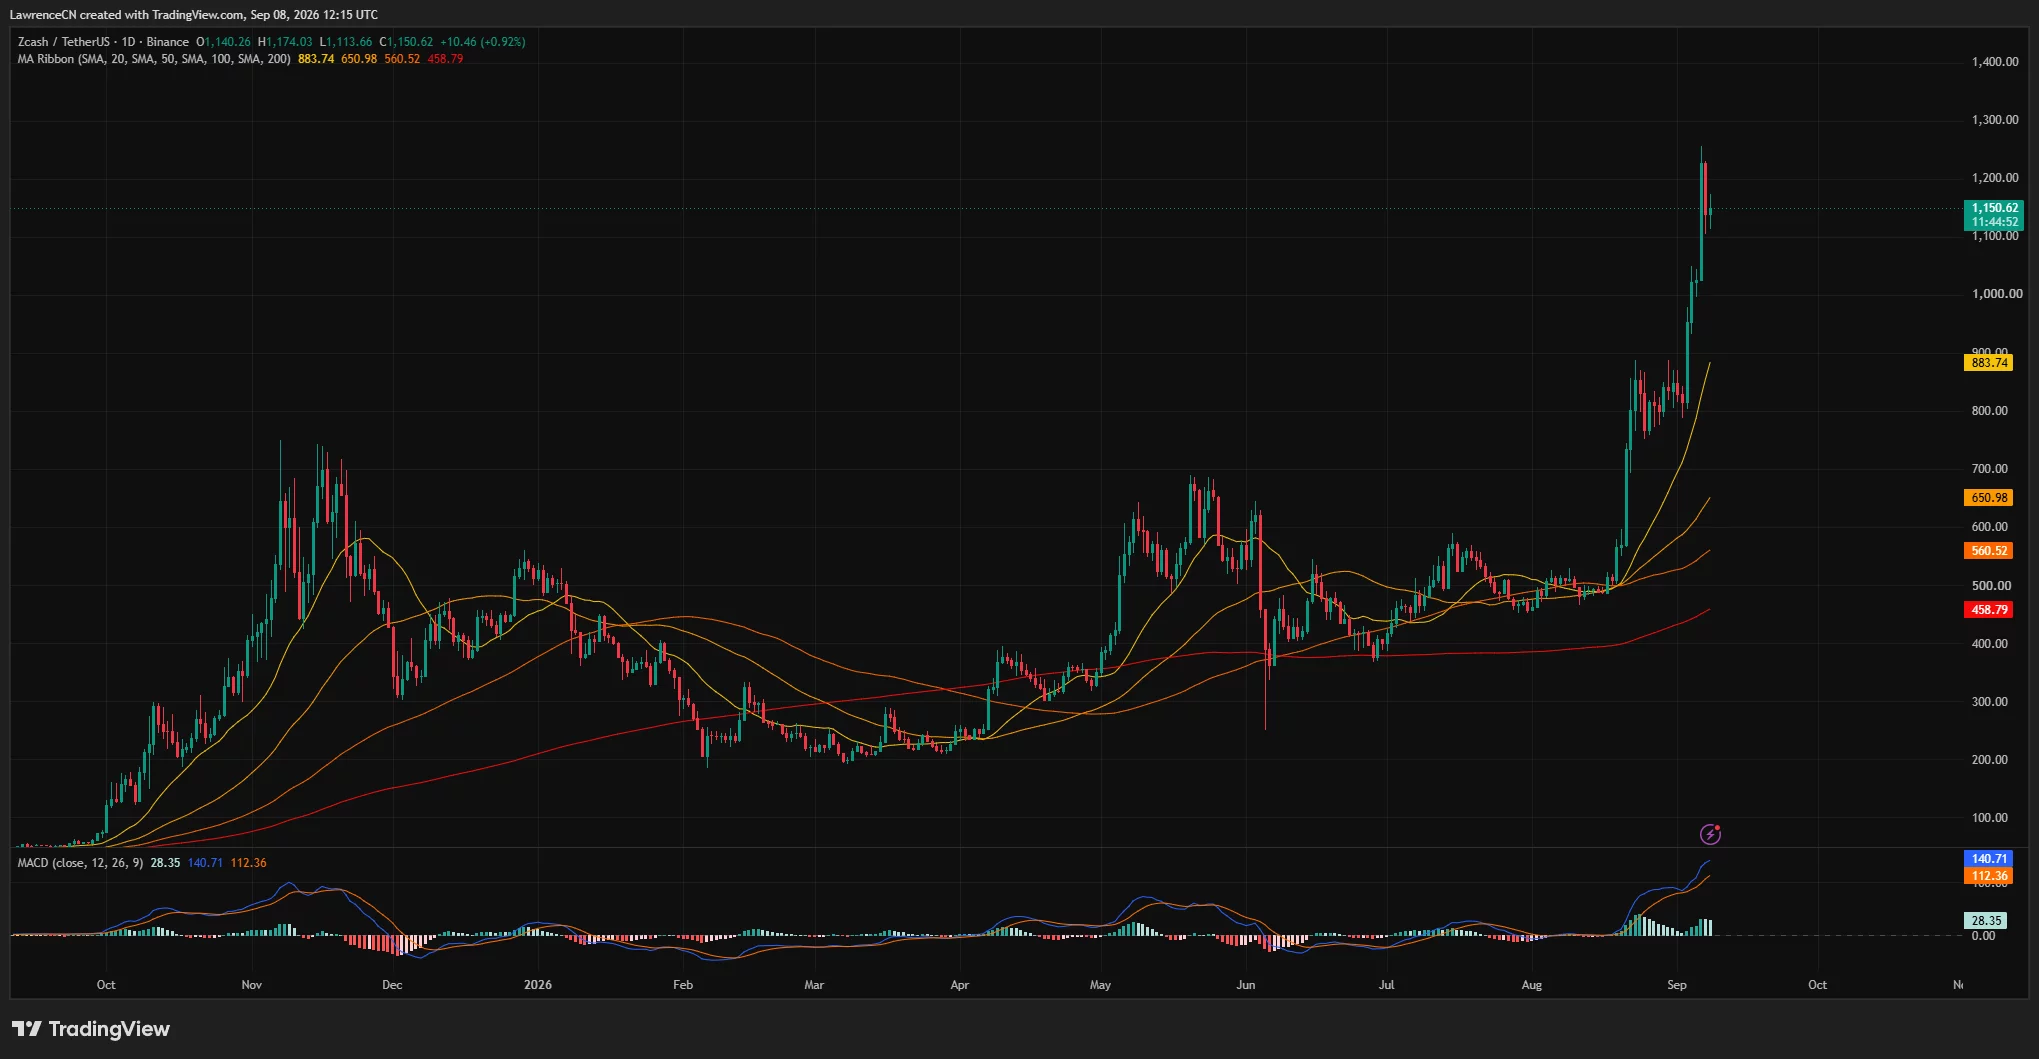
A close below the Supertrend would weaken the short-term structure and could expose the psychological $1,000 level. The former breakout zone near $875–$888 would become the deeper support area if selling accelerates.
Liquidation map points to resistance near $1,180
CoinGlass’s 24-hour ZEC liquidation heatmap shows the largest nearby concentration of leveraged positions around $1,178–$1,180. Another group of liquidation levels appears between $1,195 and $1,205.
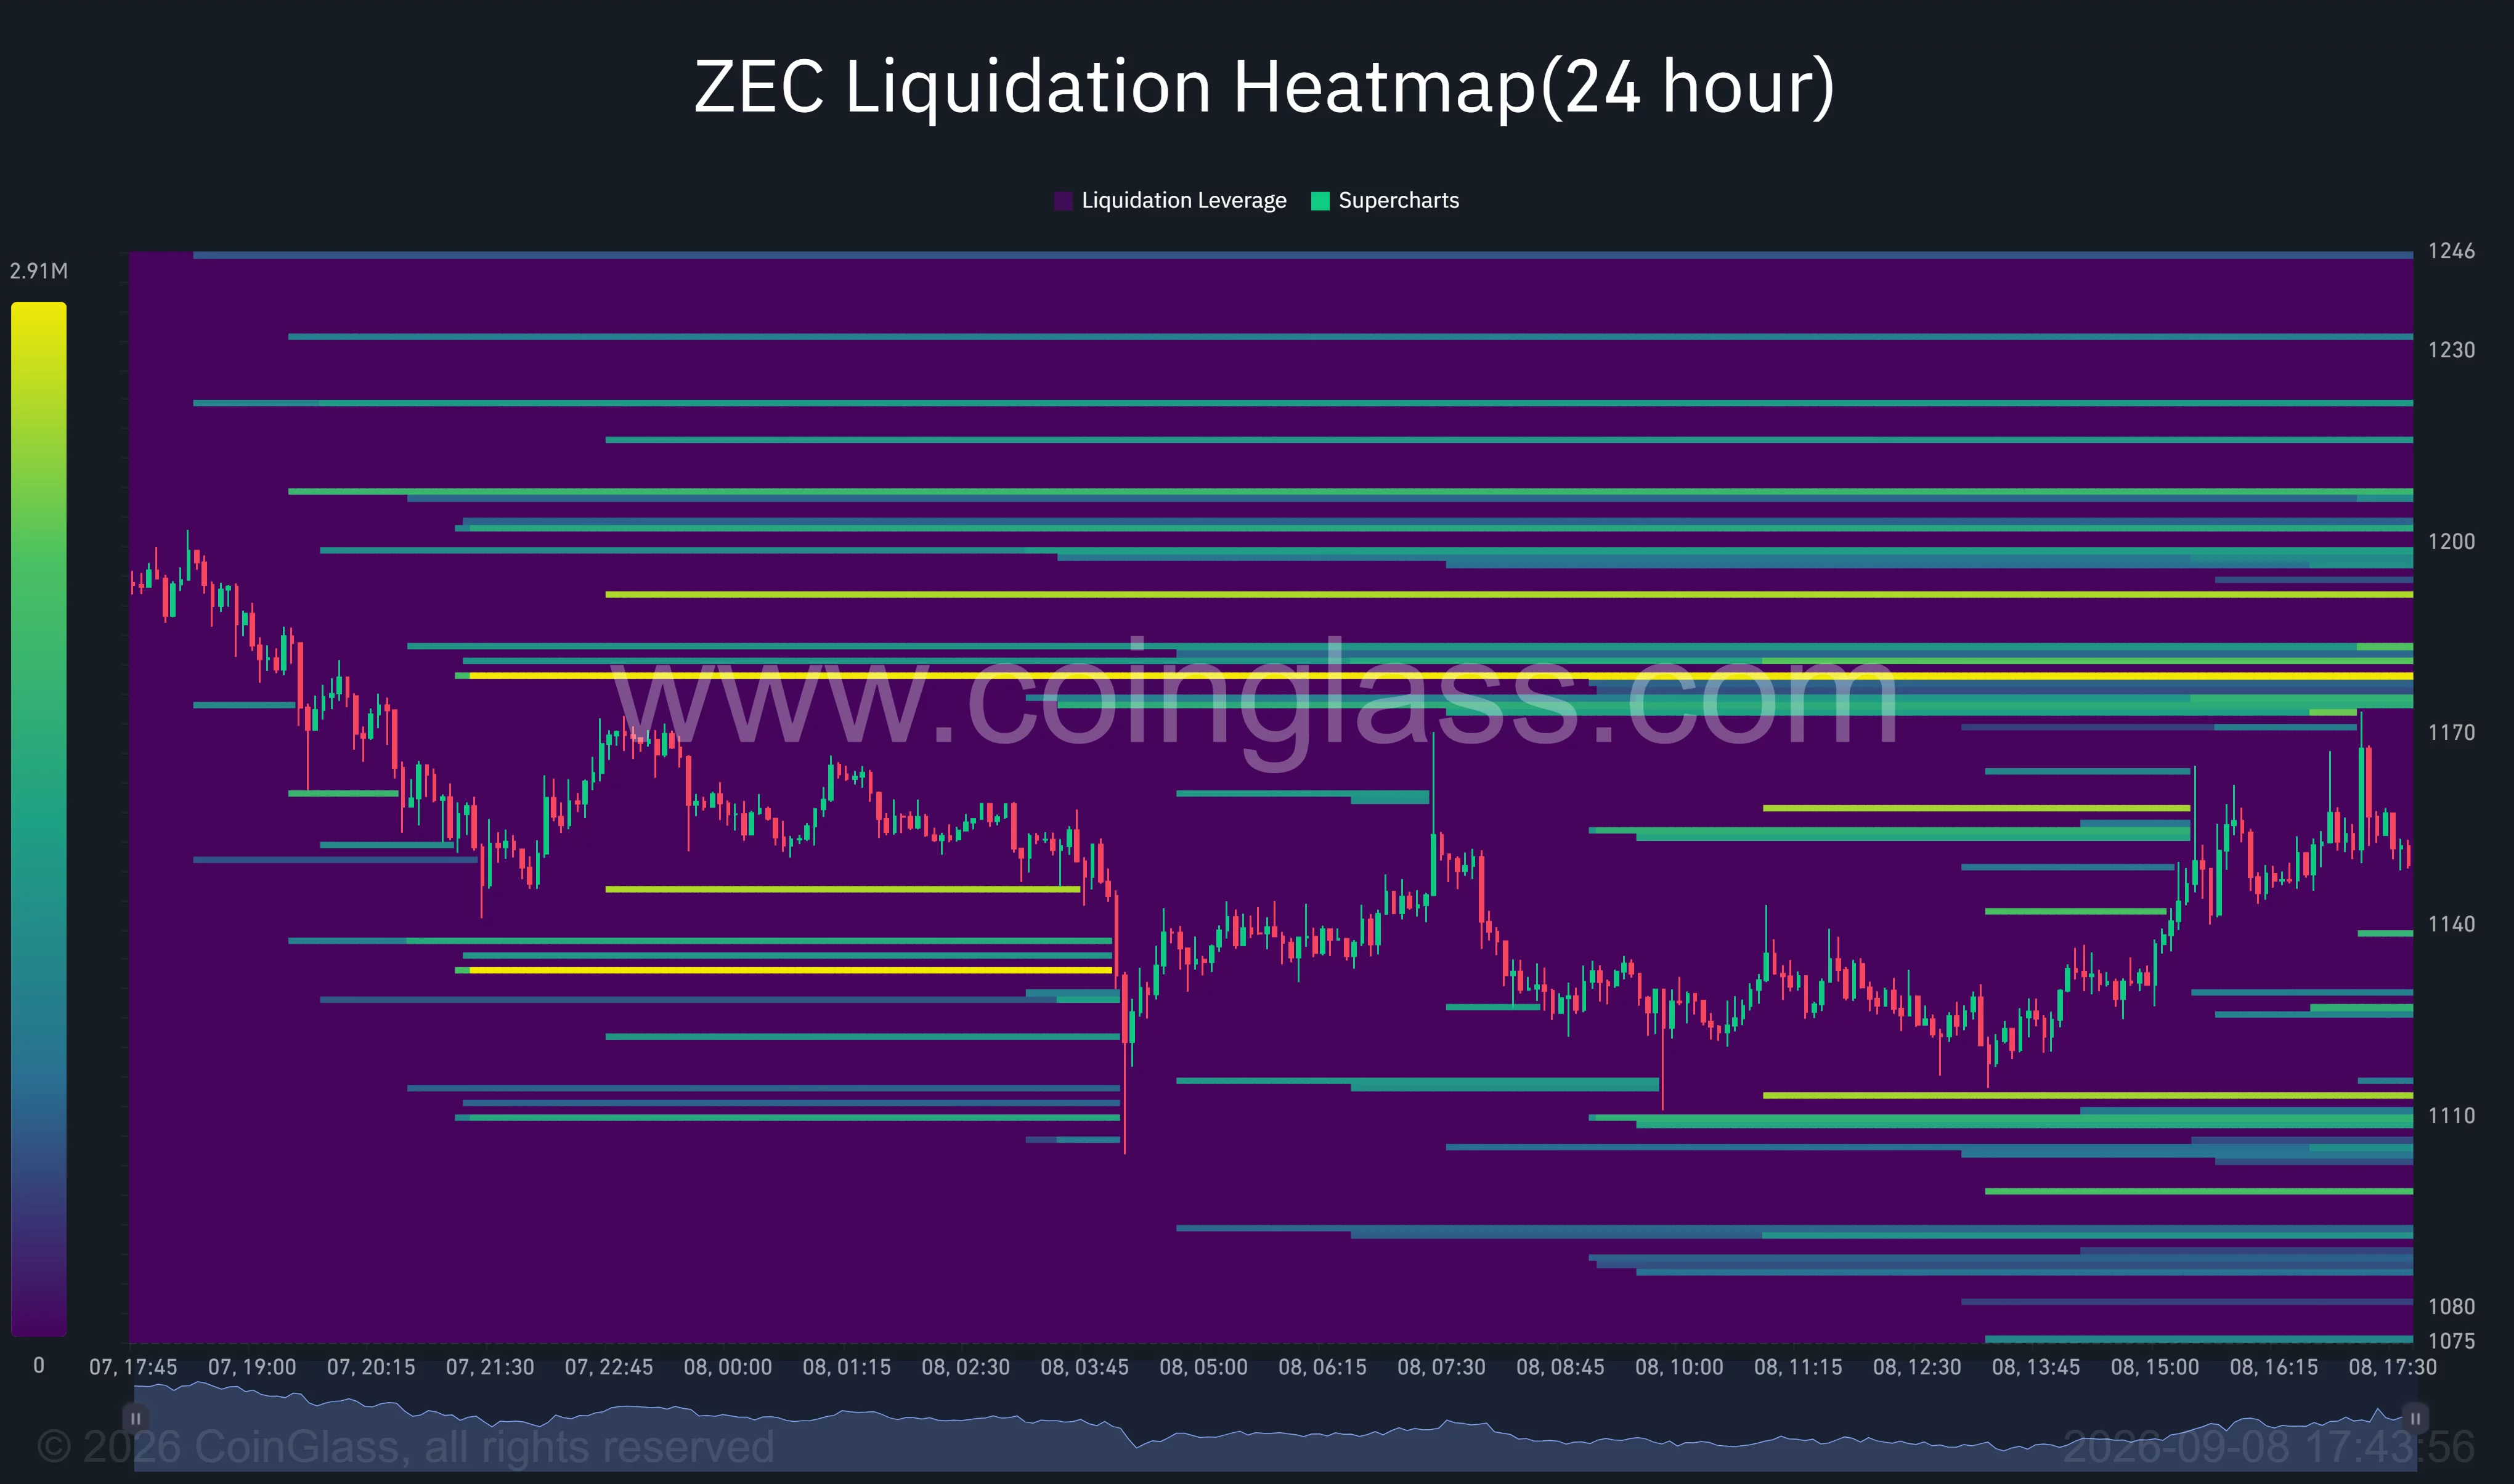
Price often moves toward areas containing concentrated leveraged positions because forced liquidations can add volume once those levels are reached. A break above $1,180 could therefore trigger another push toward $1,200 and the recent high near $1,249.
Additional liquidity sits above $1,230, but ZEC would first need to overcome the selling pressure that emerged during its initial retreat from the peak.
On the downside, the heatmap shows concentrations near $1,110 and across the $1,080–$1,100 region. Losing $1,140 could pull the price toward those levels, with the 4-hour Supertrend at $1,076 providing the next technical test.
Traders should also watch leverage on both sides of the market. The earlier short squeeze helped drive the rally, but a heavily leveraged long market could produce the opposite effect if ZEC breaks below nearby support.
Zcash bulls target $1,500 after pennant breakout
Crypto analyst Team LAMBO Charts described ZEC’s longer-term formation as a bullish pennant and said the token had already surpassed the pattern’s initial $1,000 target.
The analyst identified $1,500 as the next upside objective while arguing that bulls remain in control as long as the breakout holds. From the Sep. 8 price near $1,150, reaching that target would require an advance of approximately 30%.
Before testing $1,500, ZEC must reclaim $1,200 and close above the Sep. 6 peak at $1,249. A sustained breakout beyond that high would leave limited recent price history to act as resistance, although profit-taking could increase as the token approaches the analyst’s target.
The bearish scenario begins with a 4-hour close below $1,076. Such a move would weaken the post-breakout structure and place $1,000 back in focus. A deeper correction toward the rising 20-day SMA near $884 would erase a larger portion of the rally but would still leave ZEC above its medium- and long-term moving averages.
For US traders, Federal Reserve expectations remain a possible source of volatility across speculative assets. Zcash has recently outperformed the broader crypto market, but shifts in rate expectations could still affect leverage and demand as traders assess the next US monetary-policy decision.
Disclosure: This article does not represent investment advice. The content and materials featured on this page are for educational purposes only.

