
Key Takeaways
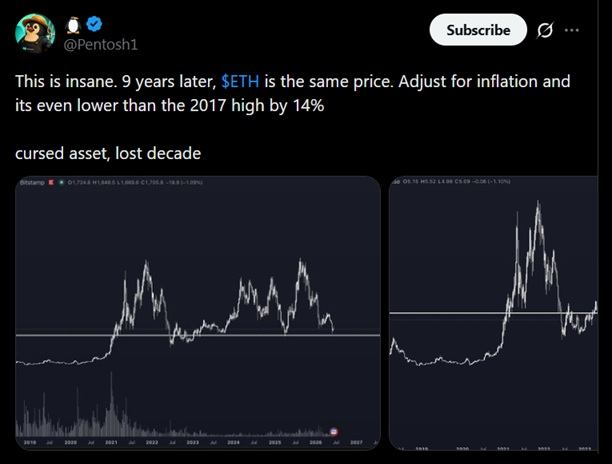
- Popular trader Pentoshi has christened ether a “cursed asset,” saying it has been flat for over nine years and is 14% lower price-wise once inflation is adjusted.
- Ether is trading near $1,700, down nearly 65% from its $4,946 all-time high set during August 2025.
- ETH has fallen roughly 44% in 2026, even as Standard Chartered has maintained a long-term $40,000 target.
A Brutal Verdict
The trader argued that ether is currently going for the same price it commanded nine years ago, and that once inflation is factored in, it sits roughly 14% below its 2017 peak. The numbers behind the complaint are stark as Ether is trading just below $1,700, leaving it down roughly 65% from the all-time high of about $4,946 (reached in August 2025).
Bitcoin.com News recently reported that ether has lost around 44% of its value through 2026 alone, a far steeper drawdown than bitcoin over the same stretch.
Pentoshi’s lost-decade posturing tracks ether’s long price history with the token first approaching the $1,400 level in early 2018 during the previous cycle’s blow-off top. More than eight years later, it trades only modestly above that mark in nominal terms and, by the trader’s math, below it (once the dollar’s reduced purchasing power is accounted for).
That argument lands amid an awful stretch for the network’s stewards, with Bitcoin.com News highlighting late last month that ether has struggled to hold the $2,000 line even as bitcoin has held relative ground. Not only that, even the Ethereum Foundation has been navigating staff departures and questions over how to fund core development moving ahead.
Simply put, critics are increasingly pointing toward ETH’s lacklustre price action as evidence that years of upgrades have not translated into durable value for holders.
The Bull Case Hasn’t Vanished
Not everyone has partaken in the gloom as Standard Chartered has maintained a solid long-term price target of $40,000 for ether despite the steep decline, betting that exchange-traded fund (ETF) flows, staking yields and layer-2 activity will eventually reassert themselves. The bank’s analysts argue the current weakness reflects a rotation into competing chains rather than a permanent loss of relevance.
Supporters also point to the network’s fundamentals, citing billions of dollars in decentralized finance ( DeFi) activity, rising stablecoin settlements, and tokenization products built on Ethereum, as key markers that price charts have failed to capture.
Moreover, from its 2025 record, ether’s slide looks like a crash, but measured from its 2015 launch near 31 cents, it remains one of the best-performing assets of the era. In this light, Pentoshi’s framing seems to deliberately anchor ETH to its 2017–2018 peak, the comparison least flattering to long-term holders and the one most likely to sting newer entrants who bought near the top.
Looking ahead, holders will likely continue to watch out for catalysts, be it renewed ETF demand, successful upgrades, or a broader market turn, all things that could finally break the nine-year stalemate the trader has spoken about on X.
